Fig. 4
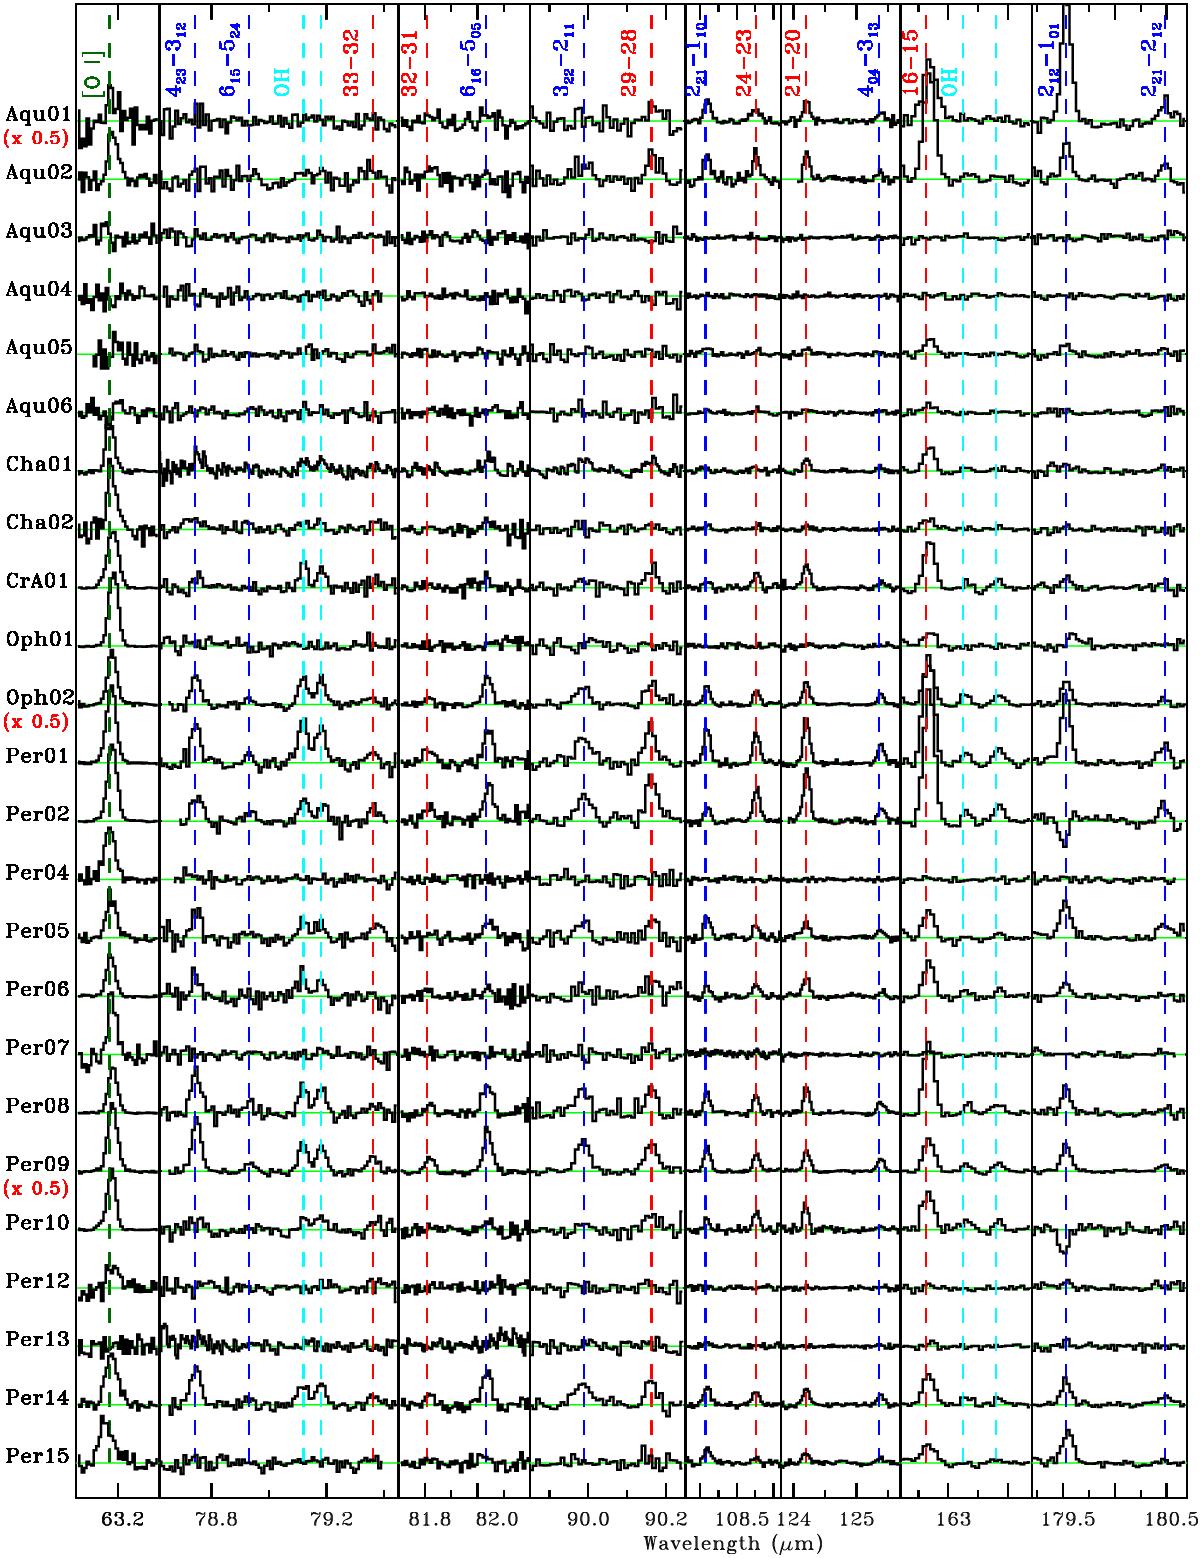
Overview of continuum-subtracted PACS spectra for selected lines. These are not corrected for the PSF. H2O, CO and OH lines are marked in blue, red and cyan, respectively, with the [O i] marked in green. The y-axis of each spectrum for all lines except [O i] goes from 0 to 5 Jy, with the brightest sources scaled down by the factor indicated in red below the source name. The [O i] spectra are scaled separately by a factor between 0.05 and 1.
Current usage metrics show cumulative count of Article Views (full-text article views including HTML views, PDF and ePub downloads, according to the available data) and Abstracts Views on Vision4Press platform.
Data correspond to usage on the plateform after 2015. The current usage metrics is available 48-96 hours after online publication and is updated daily on week days.
Initial download of the metrics may take a while.