Free Access
Fig. 15
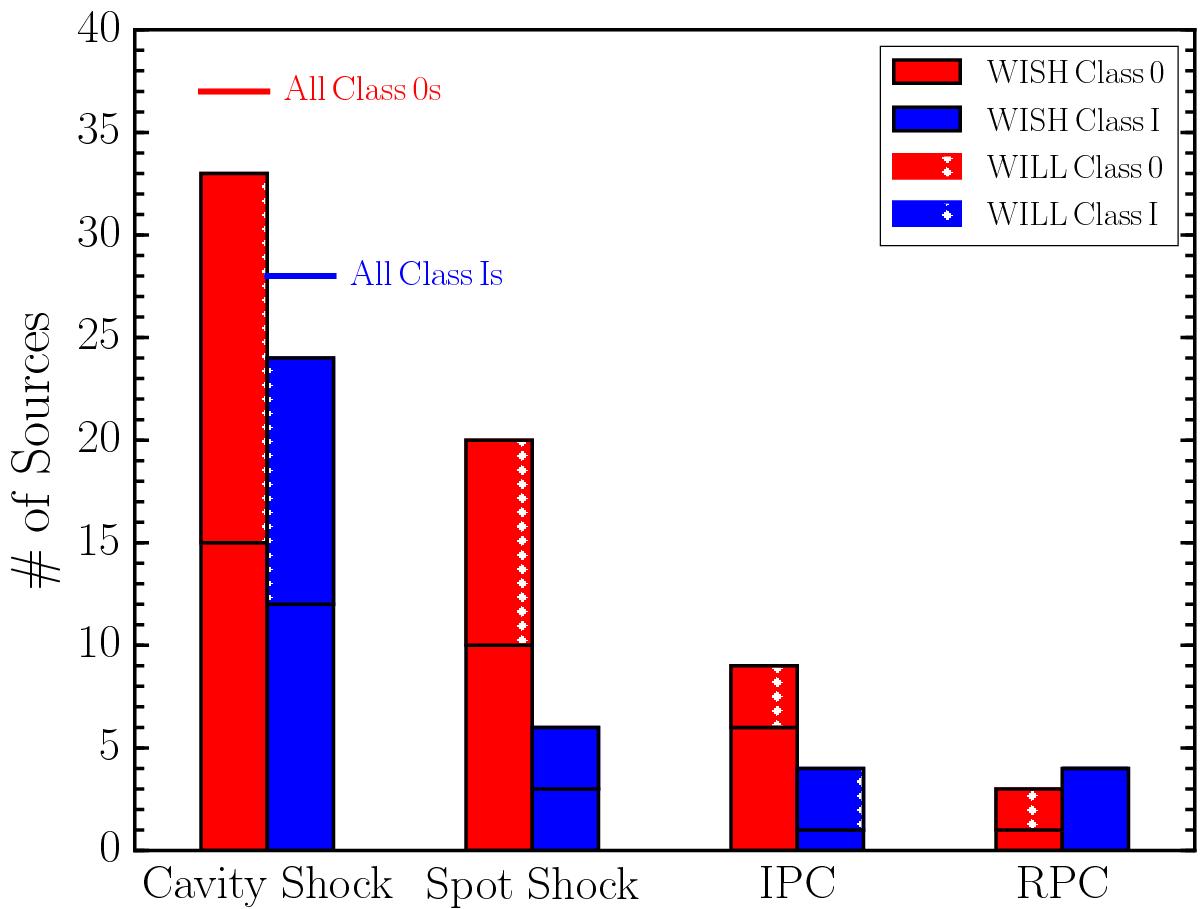
Bar chart of the number of shock and inverse/regular P-Cygni envelope components seen in water in the WISH (solid) and WILL (hatched) surveys for Class 0 (red) and I (blue) sources. The horizontal red and blue lines indicate the total number of Class 0 and I sources across both samples respectively.
Current usage metrics show cumulative count of Article Views (full-text article views including HTML views, PDF and ePub downloads, according to the available data) and Abstracts Views on Vision4Press platform.
Data correspond to usage on the plateform after 2015. The current usage metrics is available 48-96 hours after online publication and is updated daily on week days.
Initial download of the metrics may take a while.