Fig. 12
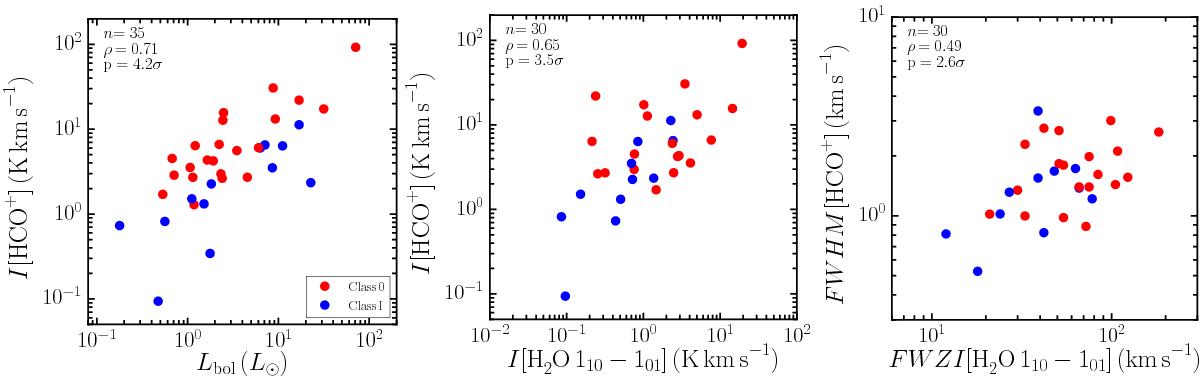
Comparison of the integrated intensity of HCO+J = 4−3 with Lbol (left) and the integrated intensity of H2O 110 −101 scaled to a distance of 200 pc (middle), as well as the FWHM of HCO+ vs. the FWZI of H2O 110 −101 (right). The number of sources, correlation coefficient and probability that the correlation is not just due to random distributions in the variables are shown in the upper-left of each panel.
Current usage metrics show cumulative count of Article Views (full-text article views including HTML views, PDF and ePub downloads, according to the available data) and Abstracts Views on Vision4Press platform.
Data correspond to usage on the plateform after 2015. The current usage metrics is available 48-96 hours after online publication and is updated daily on week days.
Initial download of the metrics may take a while.