Fig. 11
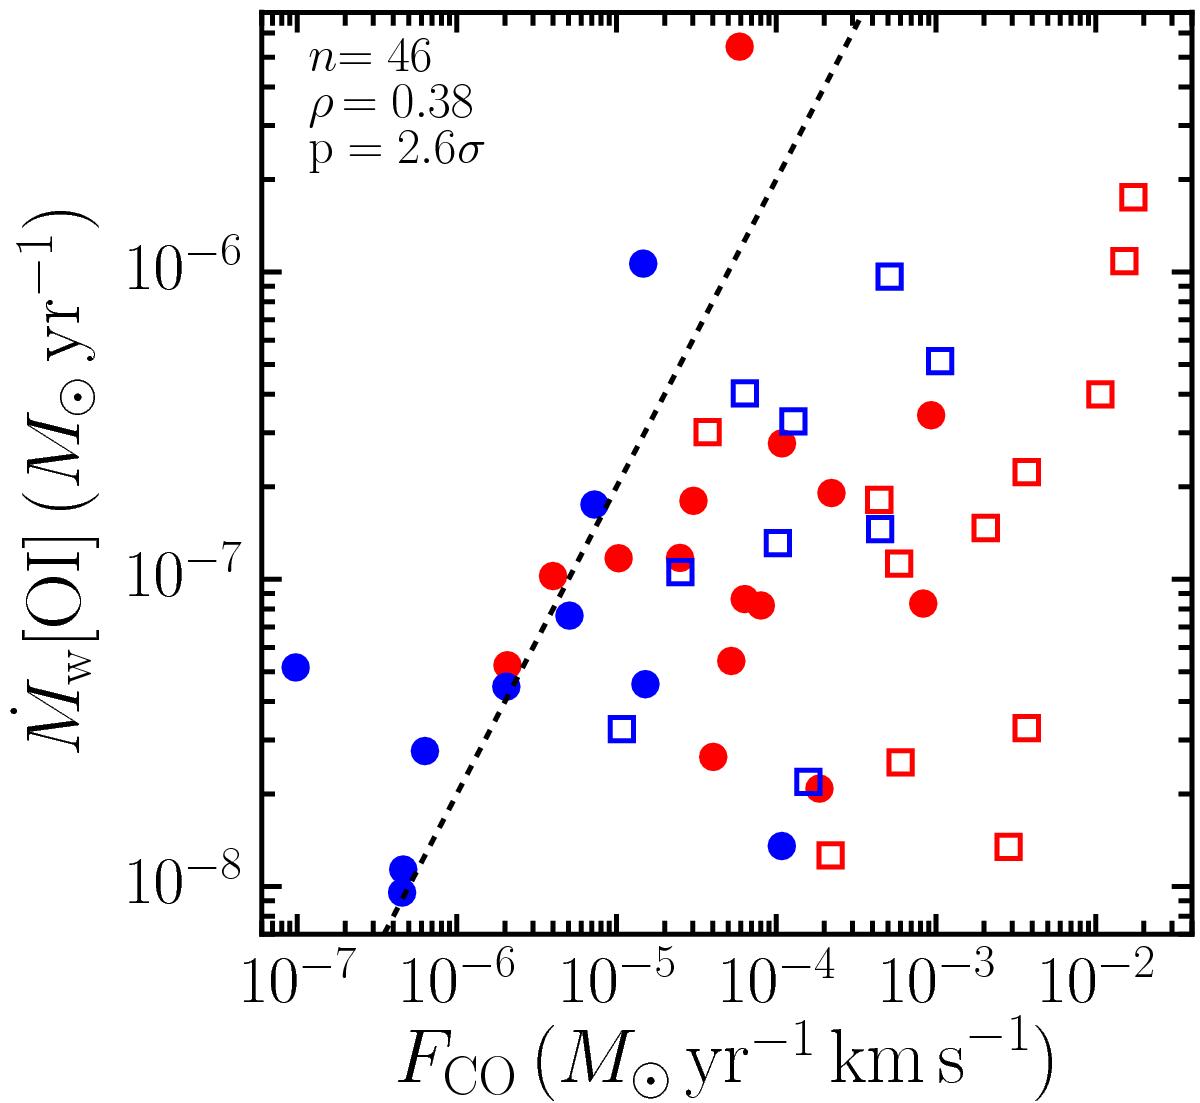
Ratio of mass-loss rate in the wind from [O i] to the outflow force from CO J = 3−2. The dashed line indicates the expected locus if both trace the mass-loss rate in the wind, νw = 100 km s-1 and ϵent = 0.5. Lower values of νw and/or ϵent move this line to the left. The symbols and colours have the same meaning as in Fig. 10.
Current usage metrics show cumulative count of Article Views (full-text article views including HTML views, PDF and ePub downloads, according to the available data) and Abstracts Views on Vision4Press platform.
Data correspond to usage on the plateform after 2015. The current usage metrics is available 48-96 hours after online publication and is updated daily on week days.
Initial download of the metrics may take a while.