Fig. 6
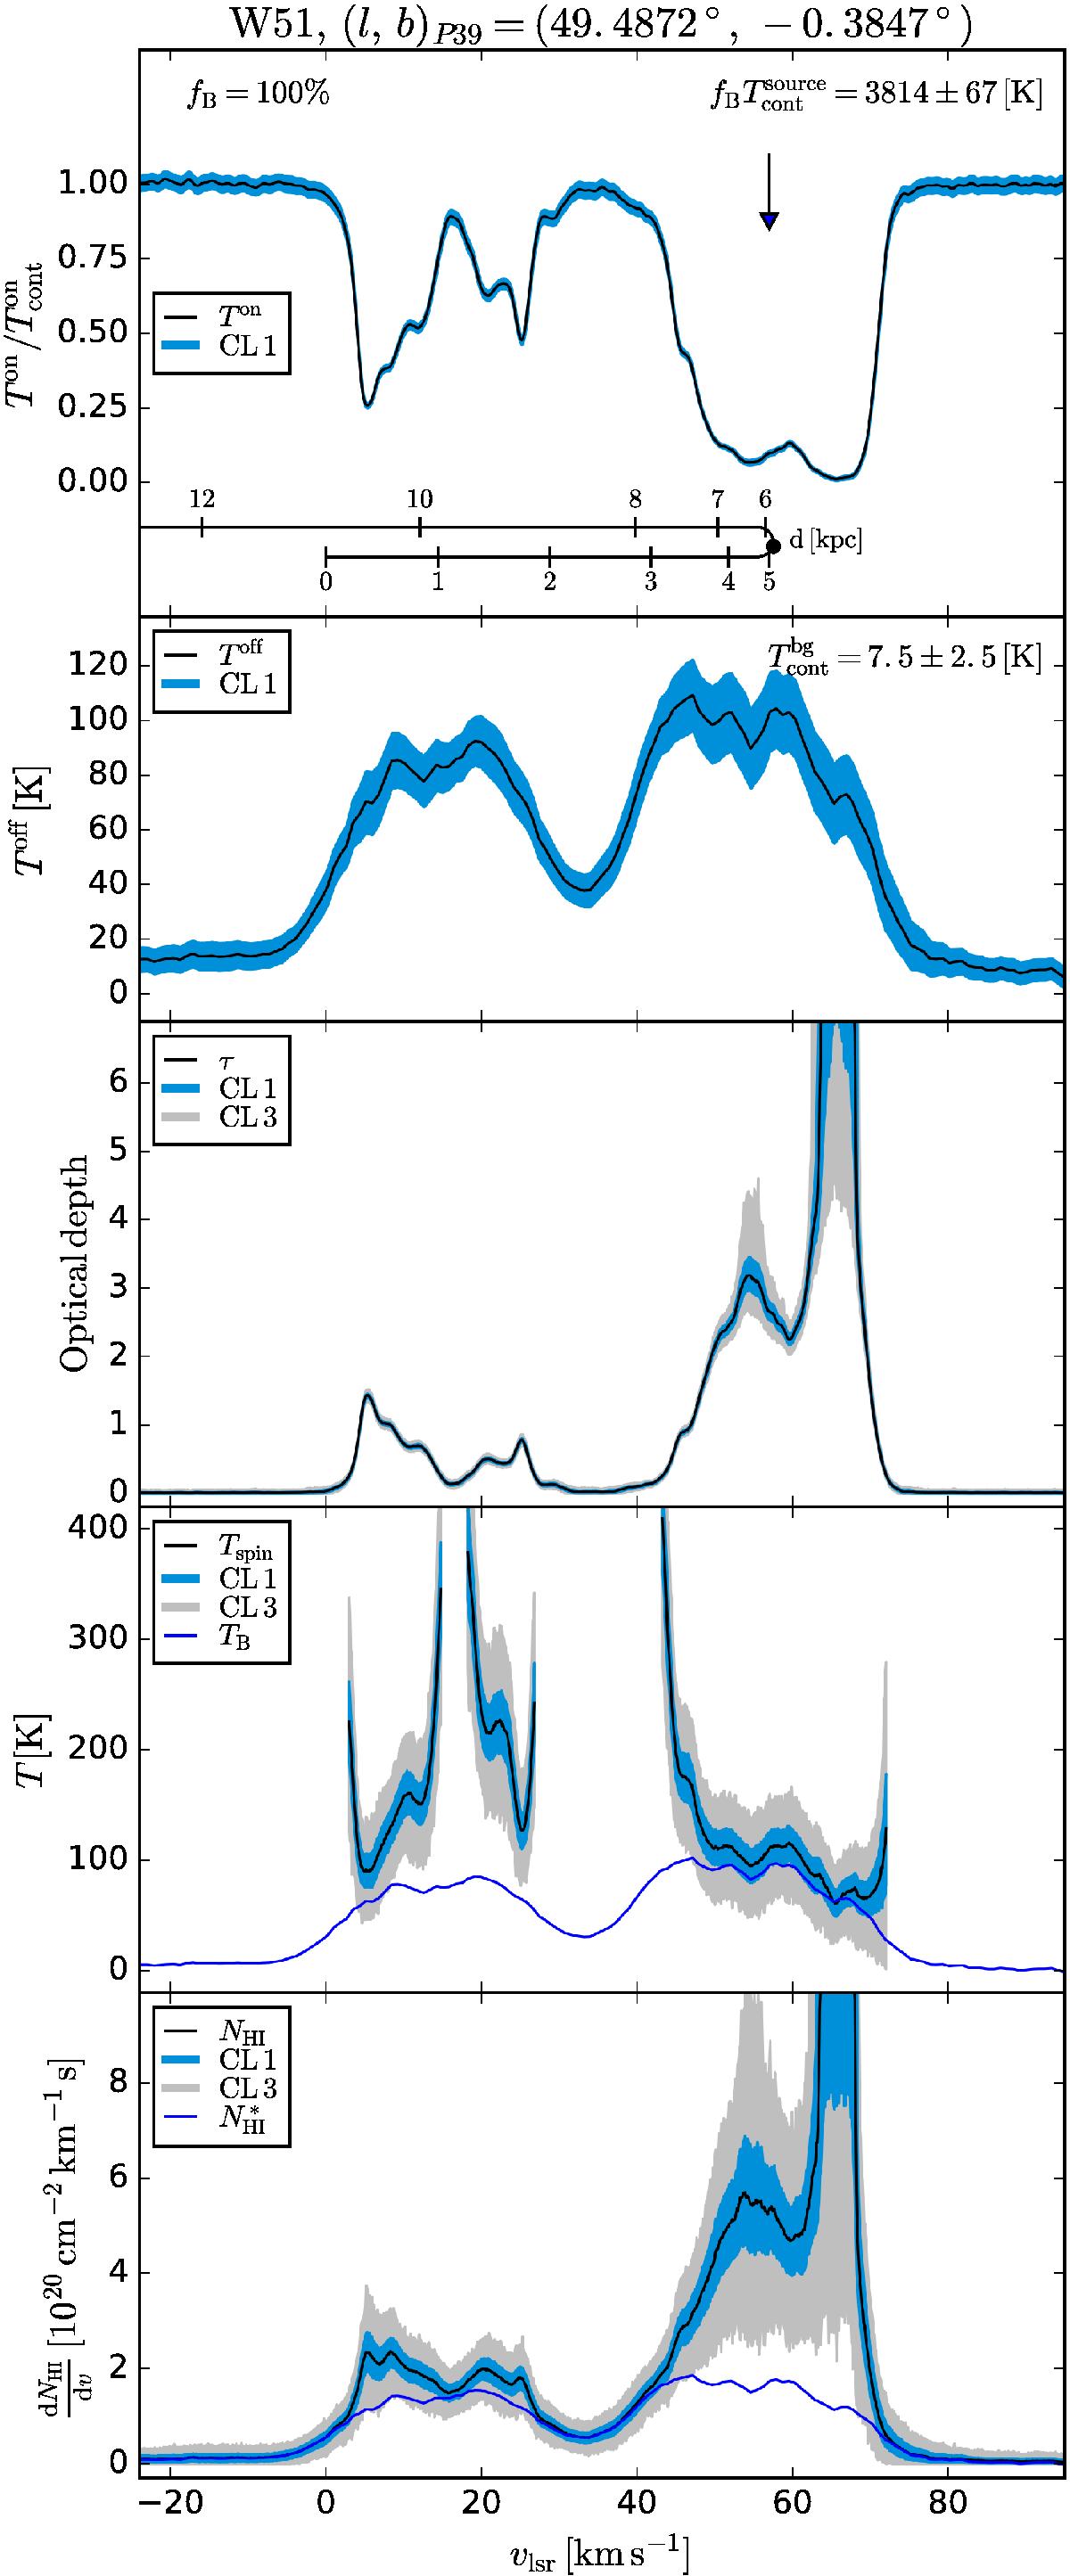
Measured absorption and emission spectra, Ton and Toff, with their respective errors, and derived quantities, optical depth, spin temperature, and H i column density for the PRISMAS program source W 51, sight line P39. For a detailed description see text. The labels CL 1 and CL 3 refer to the 1σ and 3σ confidence intervals, i.e., the 68% and 99.7% distribution percentiles (see also text).
Current usage metrics show cumulative count of Article Views (full-text article views including HTML views, PDF and ePub downloads, according to the available data) and Abstracts Views on Vision4Press platform.
Data correspond to usage on the plateform after 2015. The current usage metrics is available 48-96 hours after online publication and is updated daily on week days.
Initial download of the metrics may take a while.