Fig. 3
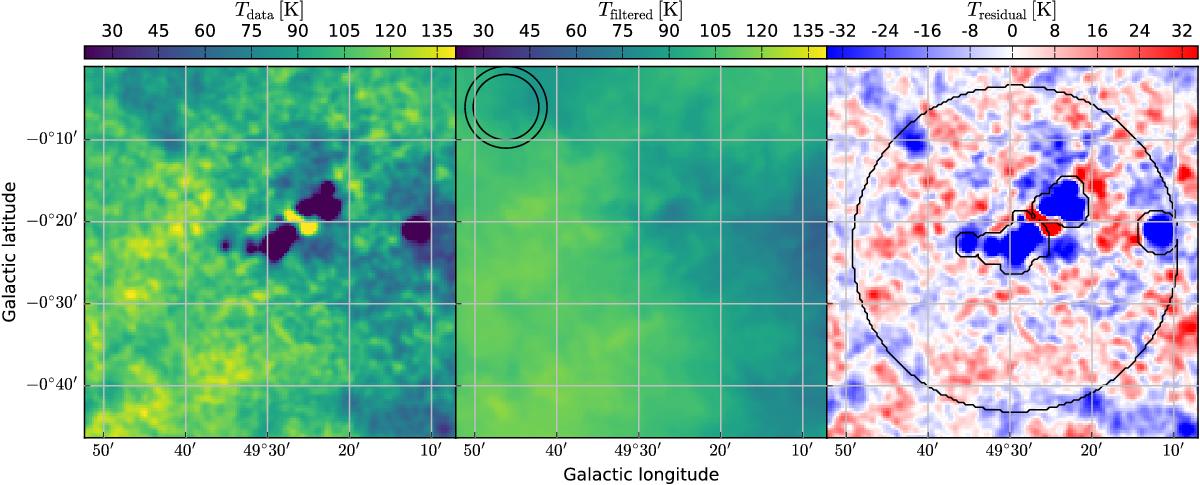
Visualization of the moving-ring filter operation used to estimate the emission spectrum, TB(ν), at the positions affected by absorption features. The left panel shows a single plane (νlsr = 45.5 km s-1) of the VGPS data cube of W 51 located in the center of the map. In the middle panel the filtered plane is shown. The size of the ring filter is marked with the two black circles in the upper left. The right panel contains the residual image. It is used to estimate the error of the emission spectrum by calculating the RMS. To improve the RMS calculation, a mask was applied (see text). The mask is indicated by the black contours.
Current usage metrics show cumulative count of Article Views (full-text article views including HTML views, PDF and ePub downloads, according to the available data) and Abstracts Views on Vision4Press platform.
Data correspond to usage on the plateform after 2015. The current usage metrics is available 48-96 hours after online publication and is updated daily on week days.
Initial download of the metrics may take a while.