Fig. 1
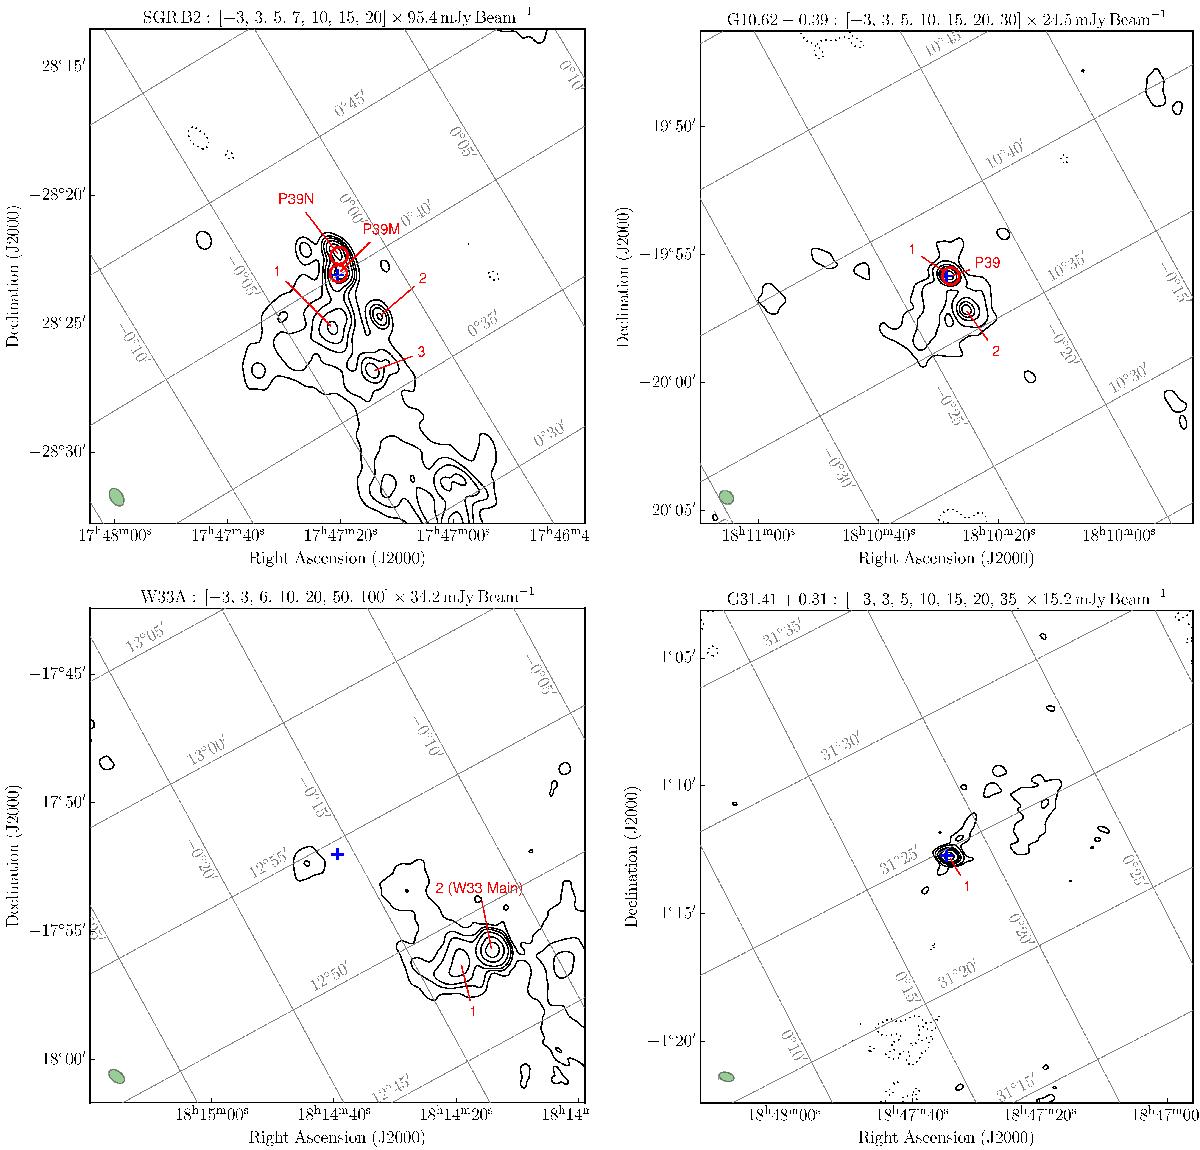
Continuum maps at 1.4 GHz of the regions Sgr B2, G 10.62−0.39, W 33 A, and G 31.41+0.31 as observed with JVLA. The sight lines extracted for our analysis are annotated. The spatial coordinates of the sight lines are compiled in Table 2 for reference. Contour lines are in multiples of the RMS noise level as stated in the title of each panel. Negative contour lines are dotted, positive contours have solid line style. The beam size is indicated by the green ellipse in the lower left corner of each map. Inside graticules display Galactic coordinates. All maps were primary-beam corrected. Note that for the sake of better visualization only the central part of each map is displayed (about half the size of the primary beam). The blue crosses mark the phase centers of the JVLA observations. PRISMAS/HEXOS program positions are labeled with “P39”, and the PRISMAS/HEXOS 550-GHz beam size of ~ 39″ is indicated by red circles. For Sgr B2 two sight lines were observed within the HEXOS program, which we annotate “P39M” and “P39N”. Note that the JVLA phase centers do not necessarily match the highest continuum intensity positions.
Current usage metrics show cumulative count of Article Views (full-text article views including HTML views, PDF and ePub downloads, according to the available data) and Abstracts Views on Vision4Press platform.
Data correspond to usage on the plateform after 2015. The current usage metrics is available 48-96 hours after online publication and is updated daily on week days.
Initial download of the metrics may take a while.