Fig. 8
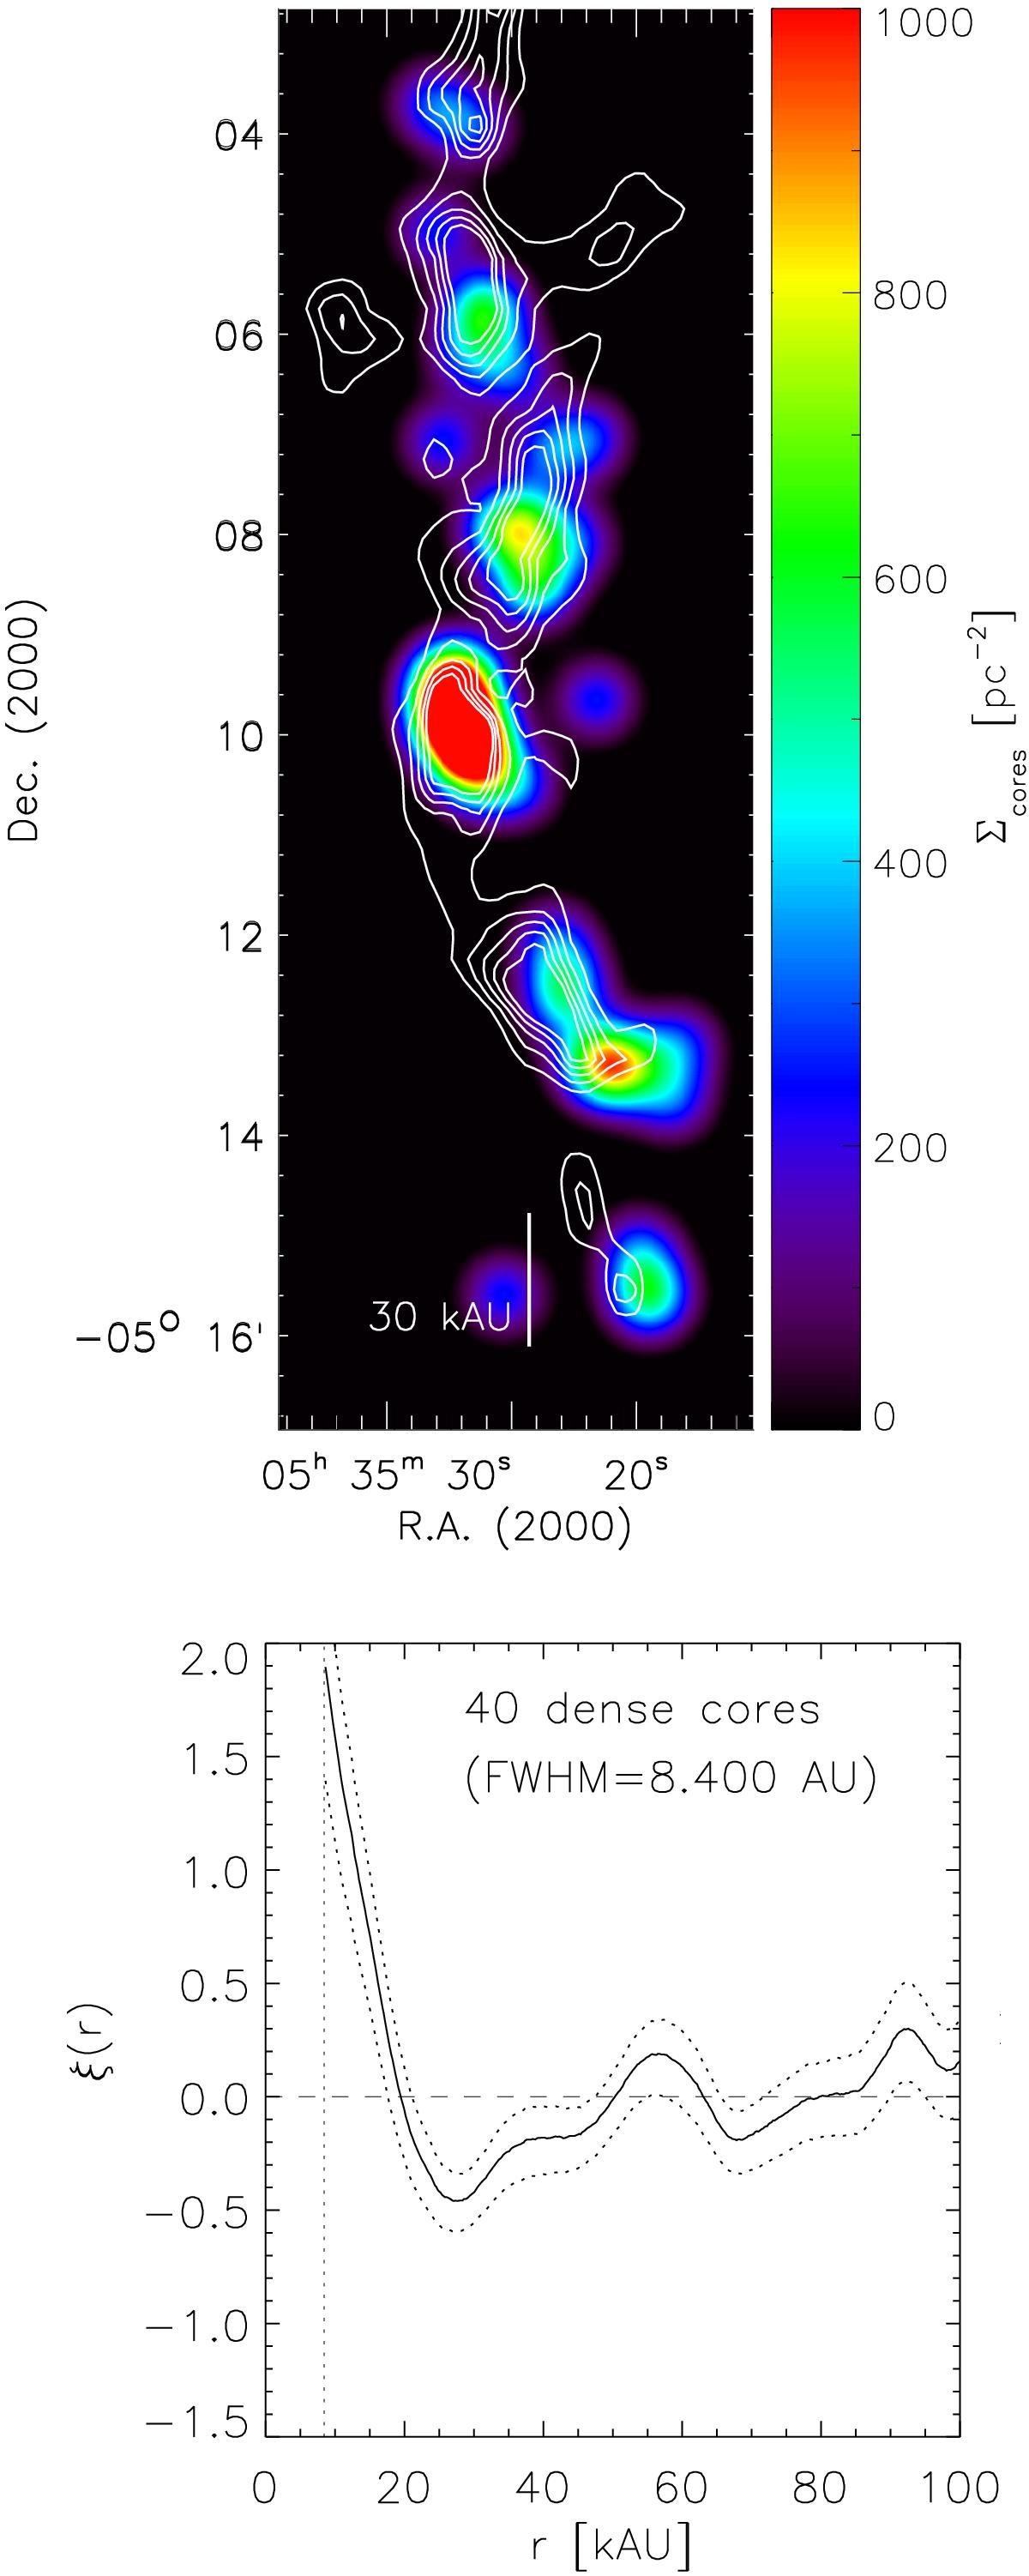
Top: surface number density of the dense cores identified from the 3 mm ALMA continuum data. The white contours show the Herschel-derived column densities at N(H) = { 60,80,100,120,140 } × 1021 cm-2 (Stutz & Kainulainen 2015). Bottom: two-point correlation function of the 43 dense cores, derived with a smoothing function with FWHM = 20″ = 8400 AU.
Current usage metrics show cumulative count of Article Views (full-text article views including HTML views, PDF and ePub downloads, according to the available data) and Abstracts Views on Vision4Press platform.
Data correspond to usage on the plateform after 2015. The current usage metrics is available 48-96 hours after online publication and is updated daily on week days.
Initial download of the metrics may take a while.