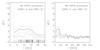
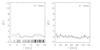
Fig. 7

Two-point correlation function of the separations of the protostars and stars with disks. The frames on the left show the separations until 25 kAU and the frames on the right until 125 kAU. The dotted curves show the confidence intervals given by three times the 25% and 75% quartiles. The vertical dotted line shows the minimum separation. The dashed horizontal line, drawn at zero, indicates a random distribution. The short vertical lines at the bottom of the panels show the observed separations (only in the panels on the left). The frames for the protostars show the function combining the protostars from the OMC-2 and 3 regions with a solid line. The function obtained for the region mapped by ALMA is shown with a dashed line (for visibility, the confidence intervals are not shown).
Current usage metrics show cumulative count of Article Views (full-text article views including HTML views, PDF and ePub downloads, according to the available data) and Abstracts Views on Vision4Press platform.
Data correspond to usage on the plateform after 2015. The current usage metrics is available 48-96 hours after online publication and is updated daily on week days.
Initial download of the metrics may take a while.