Fig. 2
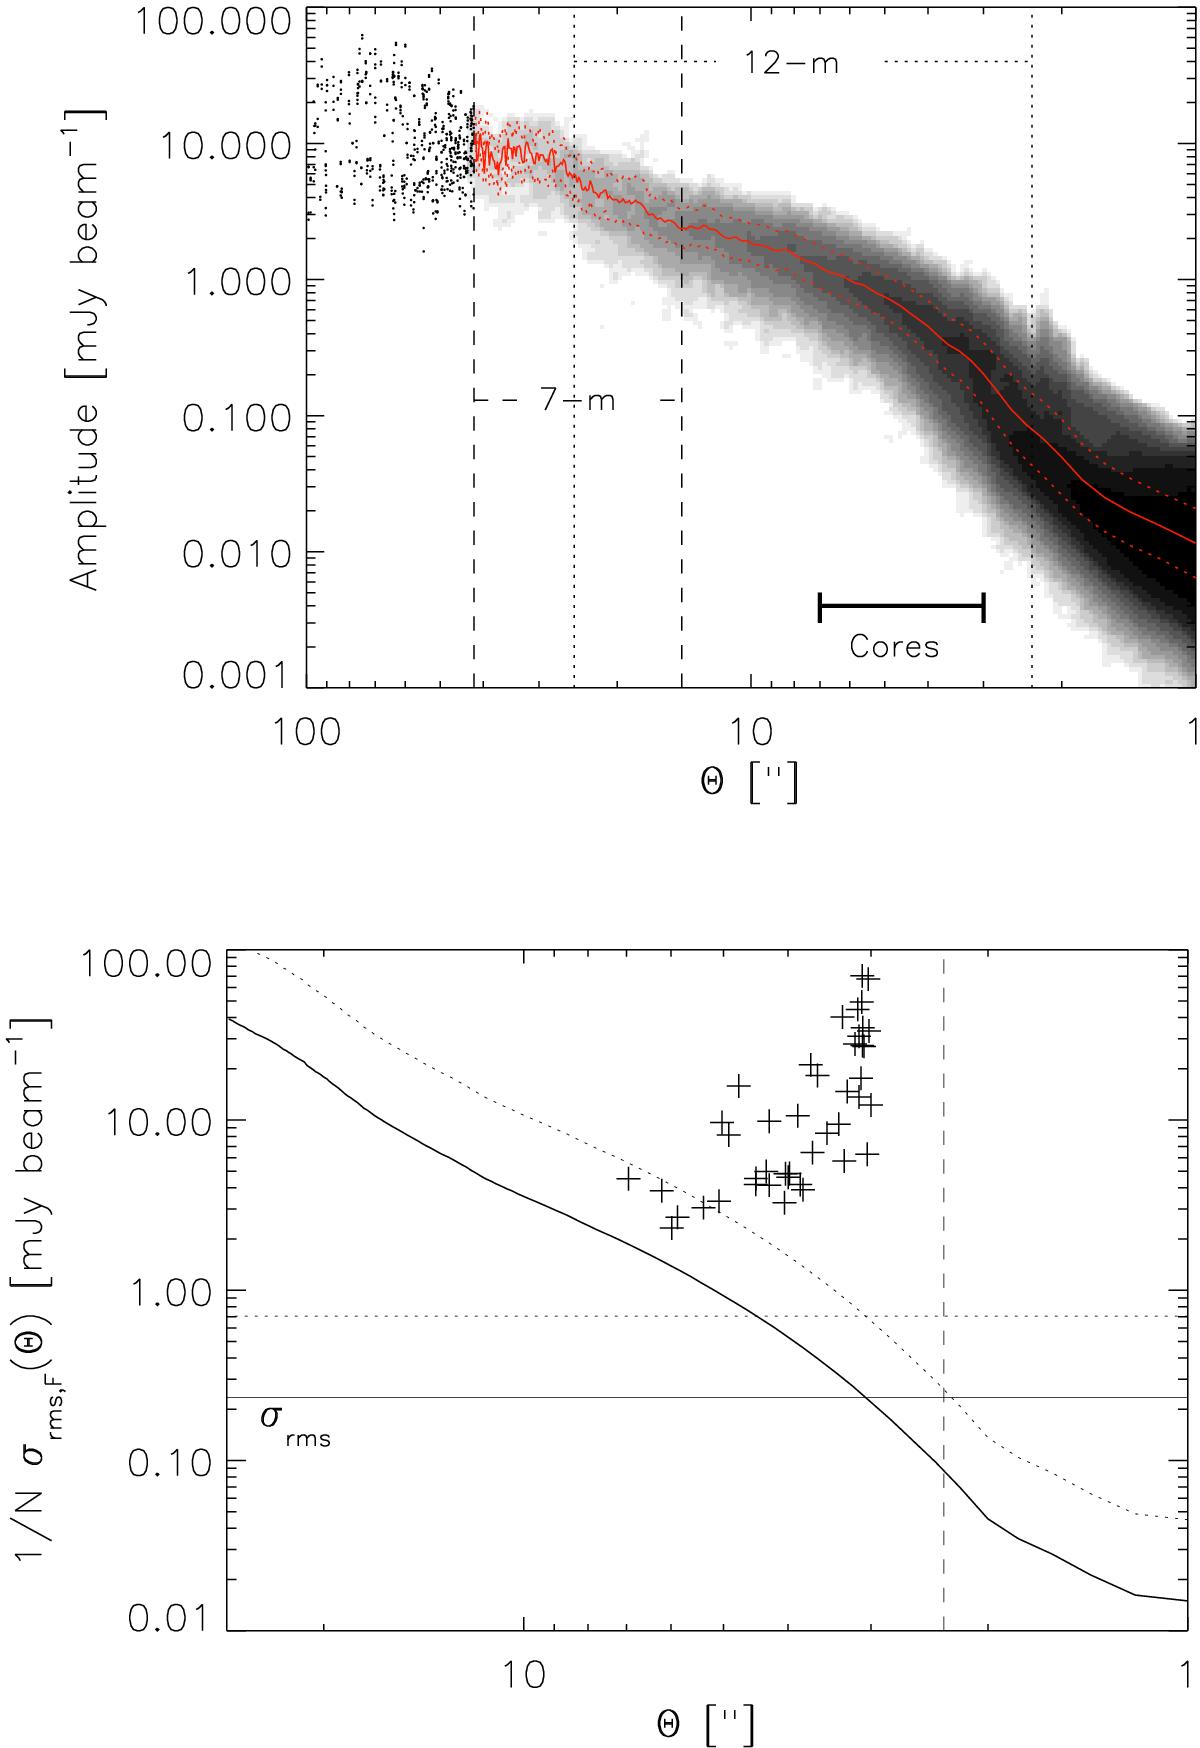
Top: amplitudes of the Fourier modes of the ALMA map. The spatial scales probed by the 12-m and 7-m arrays are indicated with vertical lines. The size range of the identified cores is shown with a horizontal line. The mean spectrum is shown with a solid red line and the standard deviation with dotted red lines. For visibility, only data points above 25′′are shown; at smaller scales the grey scale shows the density of data points. Bottom: rms noise measured in the Fourier domain, i.e., 1 /Nσrms,F(Θ). The dotted line shows the 3σrms,F(Θ) value. The horizontal lines show one (solid line) and three times (dotted line) the standard deviation measured from an apparently empty region of the ALMA map, i.e., σrms. The dashed vertical line indicates the beam size. The plusses indicate the 43 compact objects identified from the ALMA map; the y-position is determined by the peak flux and the x-position by the geometric radius of the objects.
Current usage metrics show cumulative count of Article Views (full-text article views including HTML views, PDF and ePub downloads, according to the available data) and Abstracts Views on Vision4Press platform.
Data correspond to usage on the plateform after 2015. The current usage metrics is available 48-96 hours after online publication and is updated daily on week days.
Initial download of the metrics may take a while.