Fig. 8
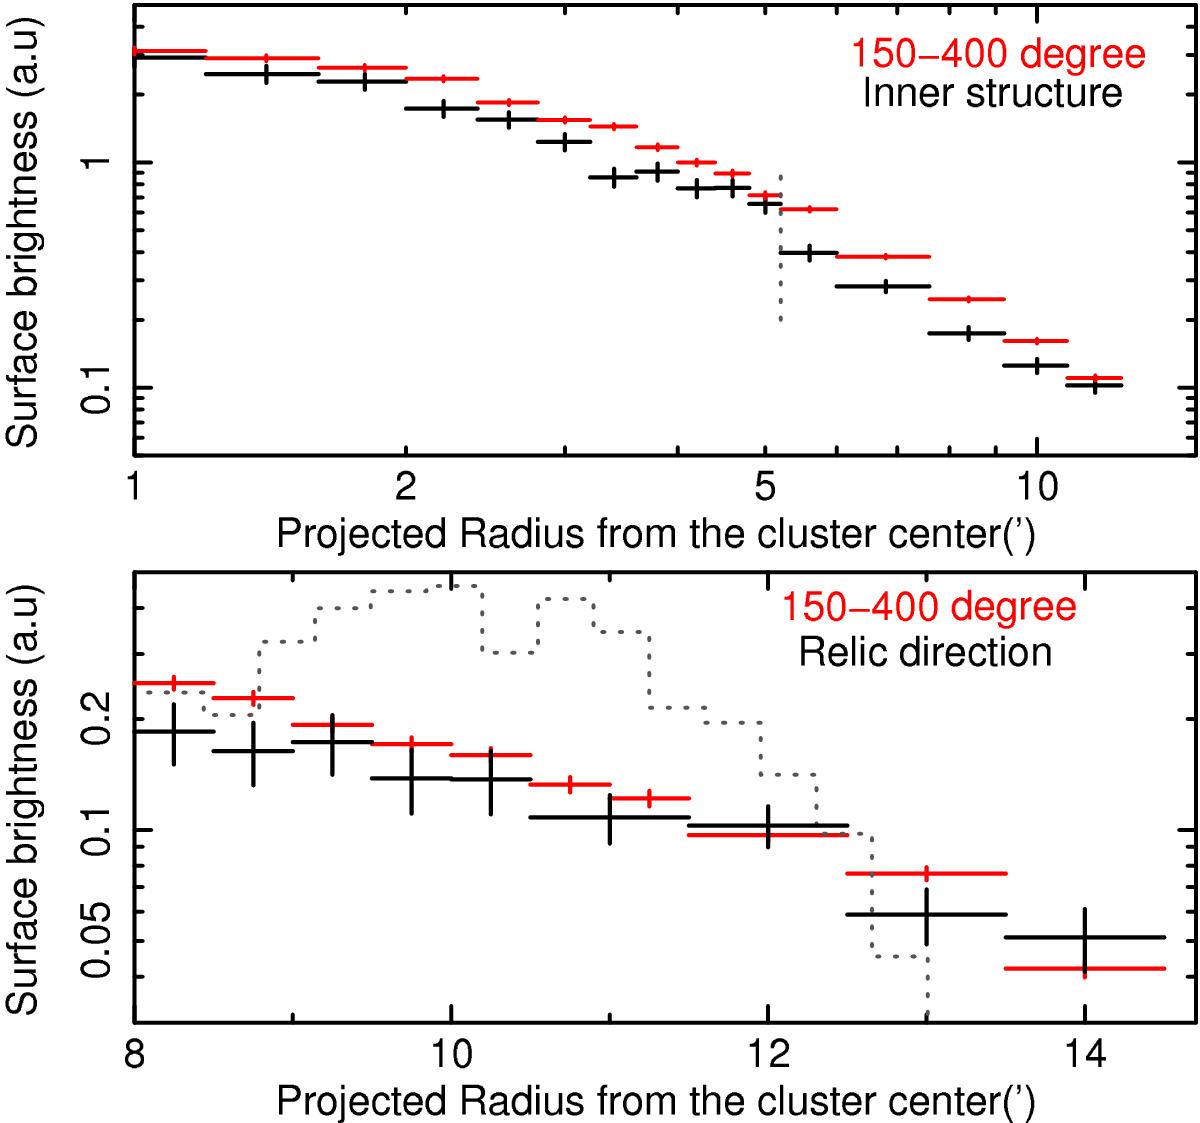
XMM-Newton 0.5–1.4 keV surface brightness profiles (top: inner temperature structure, bottom: across the radio relic). Red and black crosses represent the radial profile of an opening angle with 150°–400° and 80°–130°, respectively. In the top plot, the vertical dashed line indicates the location of the discontinuity. In the bottom plot, the dotted gray lines show WSRT 360 MHz radio emission.
Current usage metrics show cumulative count of Article Views (full-text article views including HTML views, PDF and ePub downloads, according to the available data) and Abstracts Views on Vision4Press platform.
Data correspond to usage on the plateform after 2015. The current usage metrics is available 48-96 hours after online publication and is updated daily on week days.
Initial download of the metrics may take a while.