Fig. 6
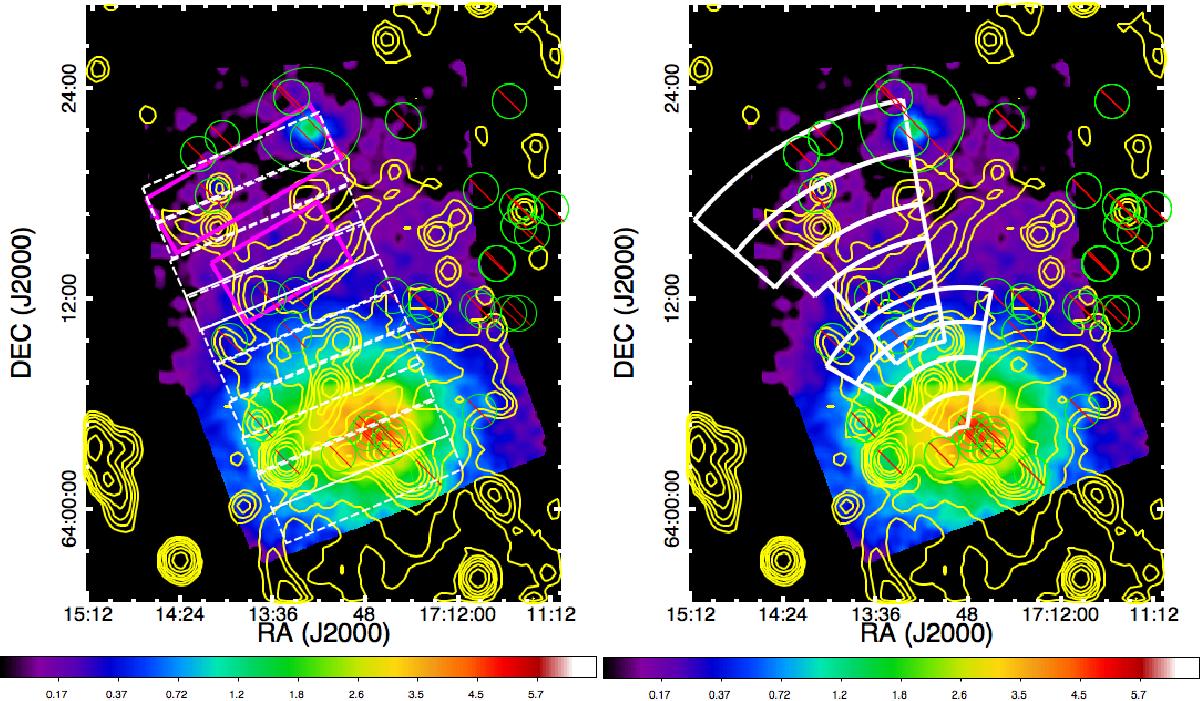
XIS image of A2255. The spectral regions used in the spectral analysis are indicated with the white boxes (2′×10′) (left) and sectors (right). In the left panel, the magenta boxes show the regions used for the pre- and post-shock region. The point sources, identified by XMM-Newton, are highlighted with the green circles (see text for details).
Current usage metrics show cumulative count of Article Views (full-text article views including HTML views, PDF and ePub downloads, according to the available data) and Abstracts Views on Vision4Press platform.
Data correspond to usage on the plateform after 2015. The current usage metrics is available 48-96 hours after online publication and is updated daily on week days.
Initial download of the metrics may take a while.