Fig. 4
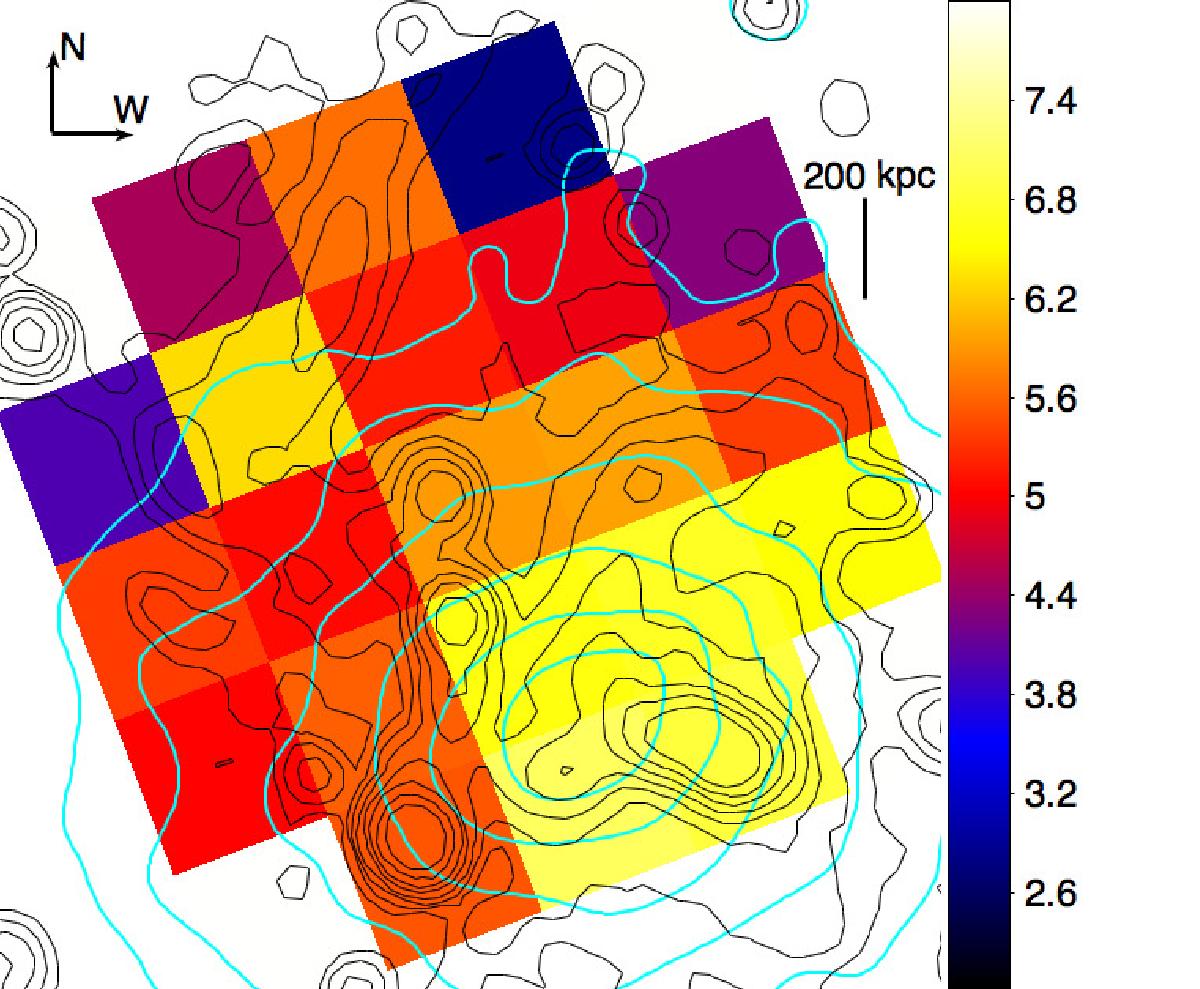
Temperature map of the central region of Abell 2255. The vertical color bar indicates the ICM temperature in units of keV. The lack of data in the four corners is due to the calibration source. The typical error for each box is about ±0.6 keV. The cyan and black contours represent X-ray (XMM-Newton) and radio surface brightness distributions.
Current usage metrics show cumulative count of Article Views (full-text article views including HTML views, PDF and ePub downloads, according to the available data) and Abstracts Views on Vision4Press platform.
Data correspond to usage on the plateform after 2015. The current usage metrics is available 48-96 hours after online publication and is updated daily on week days.
Initial download of the metrics may take a while.