Fig. 3
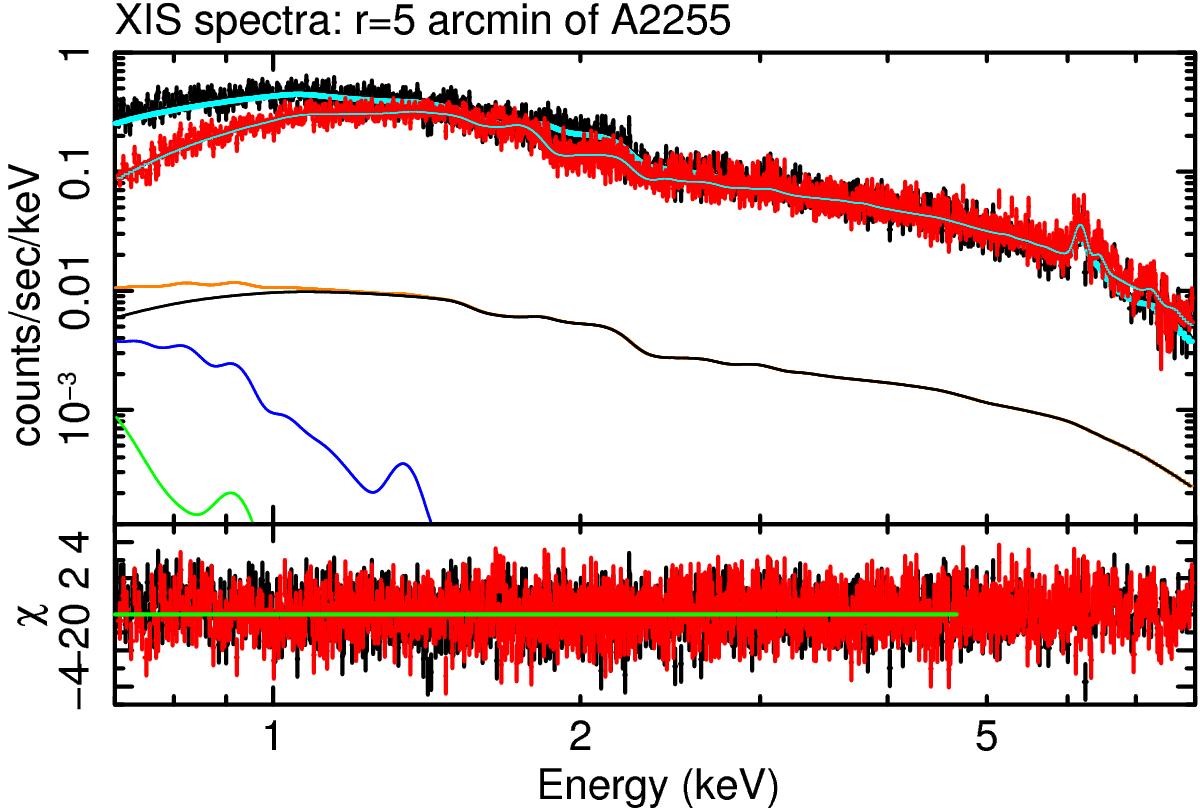
NXB-subtracted spectra of A2255 (r < 5′). The XIS BI (black) and FI (red) spectra are fitted with the ICM model (phabs × Apec), along with the sum of the CXB and Galactic emission. The ICM component is shown with the cyan line. The CXB, LHB and MWH emissions are indicated with black, green, and blue curves, respectively. The sum of all sky background emissions is shown with an orange curve.
Current usage metrics show cumulative count of Article Views (full-text article views including HTML views, PDF and ePub downloads, according to the available data) and Abstracts Views on Vision4Press platform.
Data correspond to usage on the plateform after 2015. The current usage metrics is available 48-96 hours after online publication and is updated daily on week days.
Initial download of the metrics may take a while.