Fig. 11
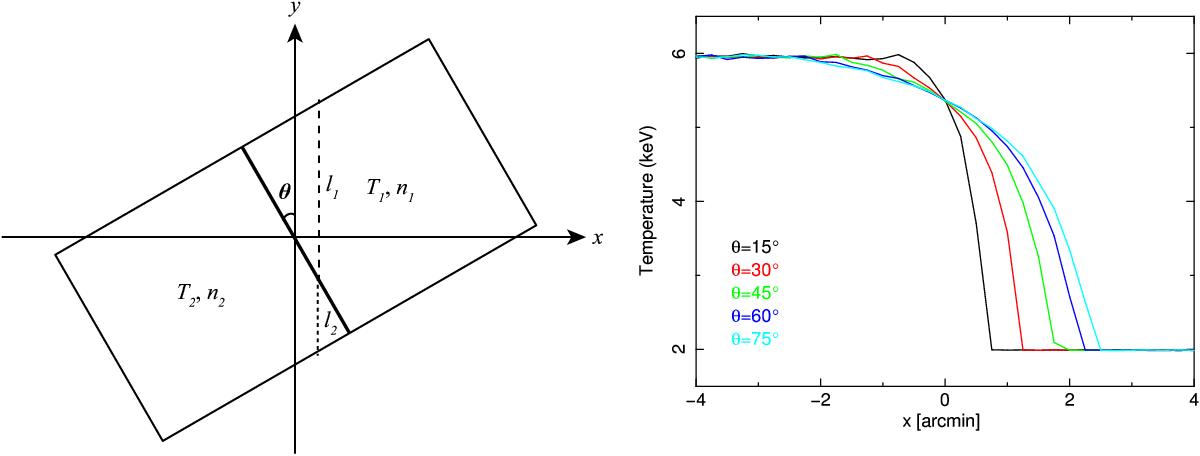
Left: ICM geometry assumed in calculating the projection effect (Sect. 4.4). The ICM temperature Ti, density ni, and line-of-sight path length li are indicated for the pre-shock (i = 1) and post-shock (i = 2) regions. Right: projected temperature profiles against the x-axis for the viewing angles of θ = 15° (black),30° (red),45° (green),60° (blue),and 75° (cyan).
Current usage metrics show cumulative count of Article Views (full-text article views including HTML views, PDF and ePub downloads, according to the available data) and Abstracts Views on Vision4Press platform.
Data correspond to usage on the plateform after 2015. The current usage metrics is available 48-96 hours after online publication and is updated daily on week days.
Initial download of the metrics may take a while.