Fig. 10
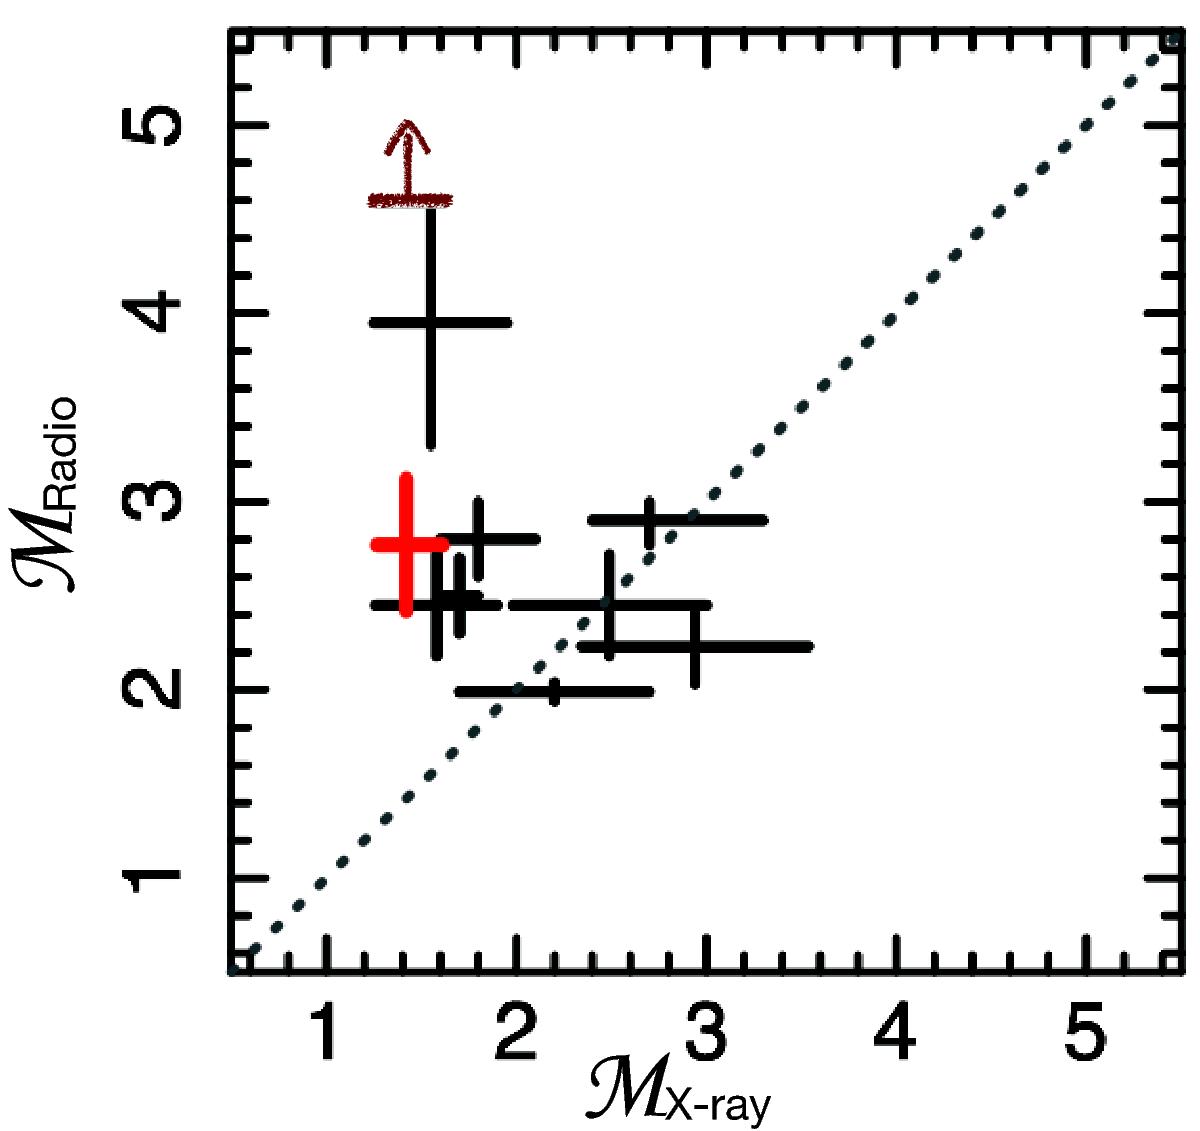
Mach number derived from radio observations (ℳradio) plotted against that from the ICM temperature (ℳX). The results of A2255 are indicated by the red cross (assuming radio spectral index: ![]() ) and the brown lower limit (
) and the brown lower limit (![]() ). The black crosses show the results of other systems (see text for the detail). The gray dashed line indicates the linear correlation as a reference. Here we note that not all Mach numbers inferred from radio observations based on injected spectral index. Therefore, future low-frequency radio observations can change the Mach numbers displayed here (see text for a detail).
). The black crosses show the results of other systems (see text for the detail). The gray dashed line indicates the linear correlation as a reference. Here we note that not all Mach numbers inferred from radio observations based on injected spectral index. Therefore, future low-frequency radio observations can change the Mach numbers displayed here (see text for a detail).
Current usage metrics show cumulative count of Article Views (full-text article views including HTML views, PDF and ePub downloads, according to the available data) and Abstracts Views on Vision4Press platform.
Data correspond to usage on the plateform after 2015. The current usage metrics is available 48-96 hours after online publication and is updated daily on week days.
Initial download of the metrics may take a while.