Fig. 1
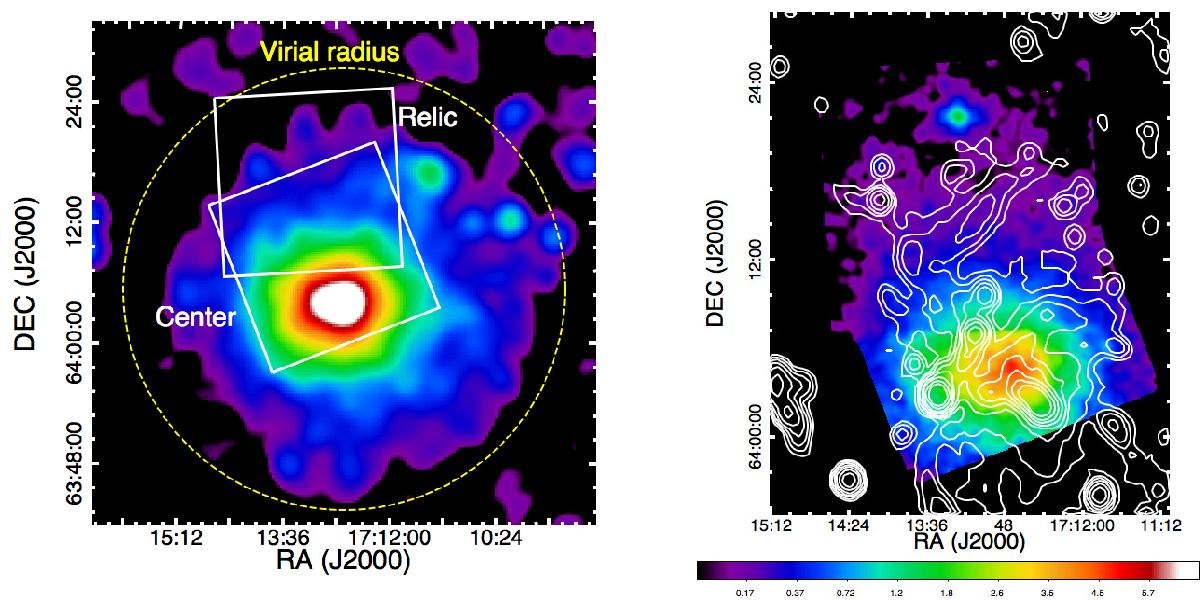
Left: ROSAT image in the 0.1–2.4 keV band of A2255. The white boxes show the FOVs in the Suzaku XIS observations that we discuss in this paper, while the yellow dashed circle shows the virial radius of A2255, r200, corresponding to 23.4′ from the cluster center (see the text for details). Right: background-subtracted Suzaku XIS3 image of A2255 in the 0.5–4.0 keV band smoothed by a two-dimensional Gaussian with σ = 8′′. The image was corrected for exposure time, but not for vignetting. The white contours are 1.0, 2.5, 5.0, 10, 20, 40, 80, and 160 mJy/beam of the WSRT 360 MHz radio intensity (Pizzo & de Bruyn 2009).
Current usage metrics show cumulative count of Article Views (full-text article views including HTML views, PDF and ePub downloads, according to the available data) and Abstracts Views on Vision4Press platform.
Data correspond to usage on the plateform after 2015. The current usage metrics is available 48-96 hours after online publication and is updated daily on week days.
Initial download of the metrics may take a while.