Fig. A.1
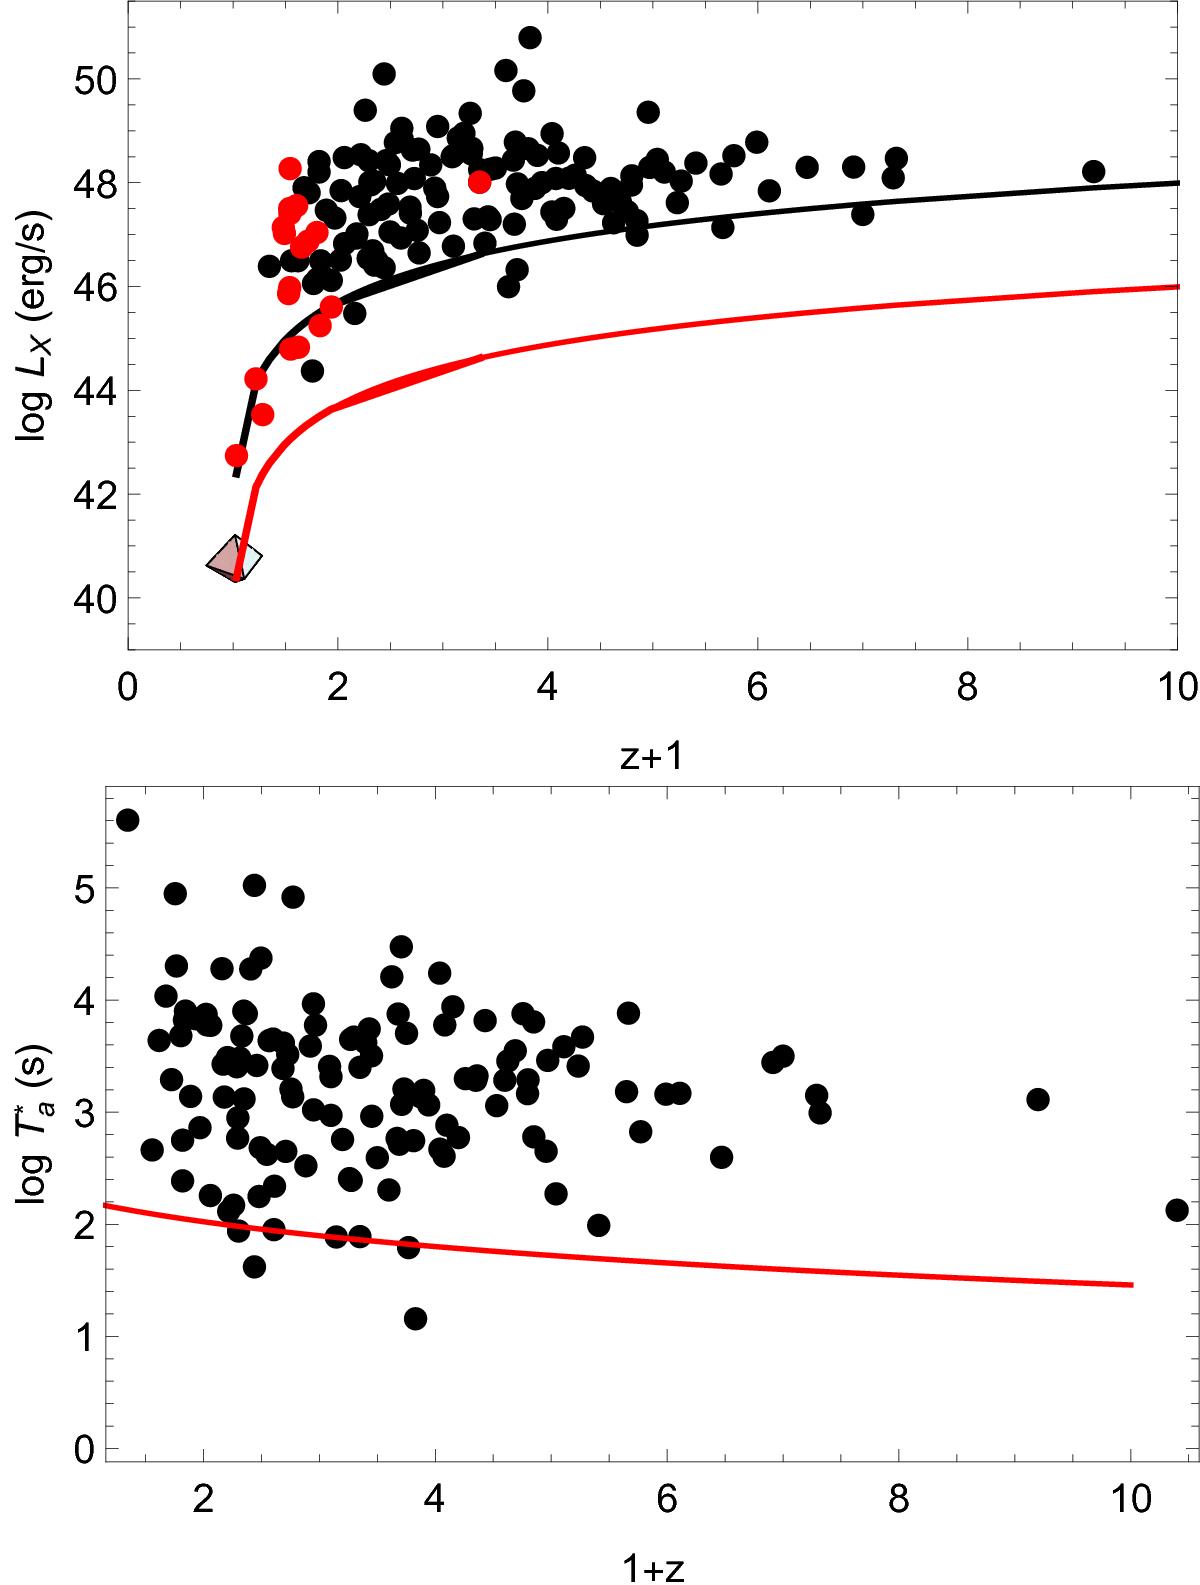
Upper panel: distribution of log LX and redshift of the LONG-NO-SNe. The limiting luminosity, obtained using the flux limit such as 2.0 × 10⁻¹² erg cm-2, shown with a solid black line, better represents the limiting luminosity of the sample. In the same panel, we show the distribution of the LONG-SNe sample in red. The solid red line represents the XRT limiting luminosity based on the XRT sensitivity in 104 s observation, facilitating the observation of GRB 980425. Lower panel: distribution of the restframe time ![]() and the redshift, where we denote with the red solid line the limiting rest frame time,
and the redshift, where we denote with the red solid line the limiting rest frame time, ![]() , with a red solid line.
, with a red solid line.
Current usage metrics show cumulative count of Article Views (full-text article views including HTML views, PDF and ePub downloads, according to the available data) and Abstracts Views on Vision4Press platform.
Data correspond to usage on the plateform after 2015. The current usage metrics is available 48-96 hours after online publication and is updated daily on week days.
Initial download of the metrics may take a while.