Fig. 2
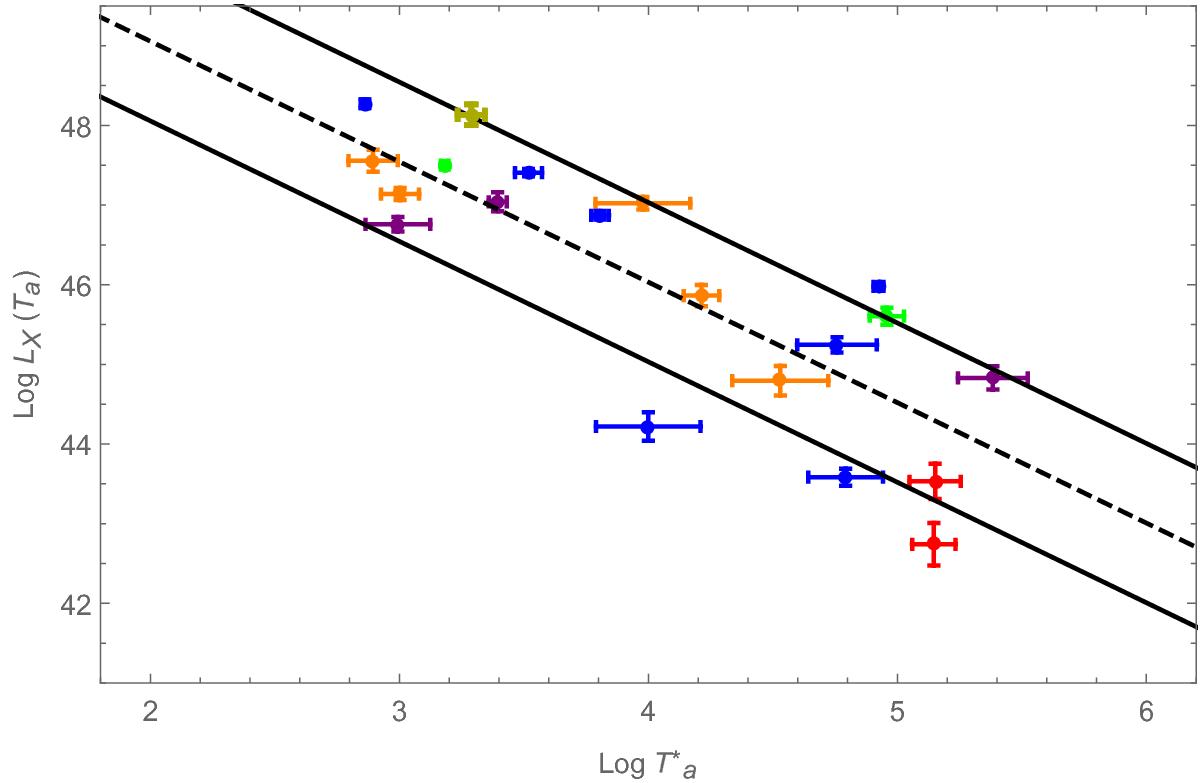
Analyzed log LX vs. ![]() distributions for LONG-SNe divided into colors depending on the category described in Table 2. Category A: red points; B: orange; C: green; D: purple; and E: blue. The dark yellow point represents a low-redshift GRB, GRB 060505, for which the SN was not seen associated with GRB; see discussion in the text. The two solid lines represent the 1σ intrinsic scatter of the Dainotti relation, while the dashed line is the best-fit line computed with the D’Agostini method.
distributions for LONG-SNe divided into colors depending on the category described in Table 2. Category A: red points; B: orange; C: green; D: purple; and E: blue. The dark yellow point represents a low-redshift GRB, GRB 060505, for which the SN was not seen associated with GRB; see discussion in the text. The two solid lines represent the 1σ intrinsic scatter of the Dainotti relation, while the dashed line is the best-fit line computed with the D’Agostini method.
Current usage metrics show cumulative count of Article Views (full-text article views including HTML views, PDF and ePub downloads, according to the available data) and Abstracts Views on Vision4Press platform.
Data correspond to usage on the plateform after 2015. The current usage metrics is available 48-96 hours after online publication and is updated daily on week days.
Initial download of the metrics may take a while.