Fig. 1
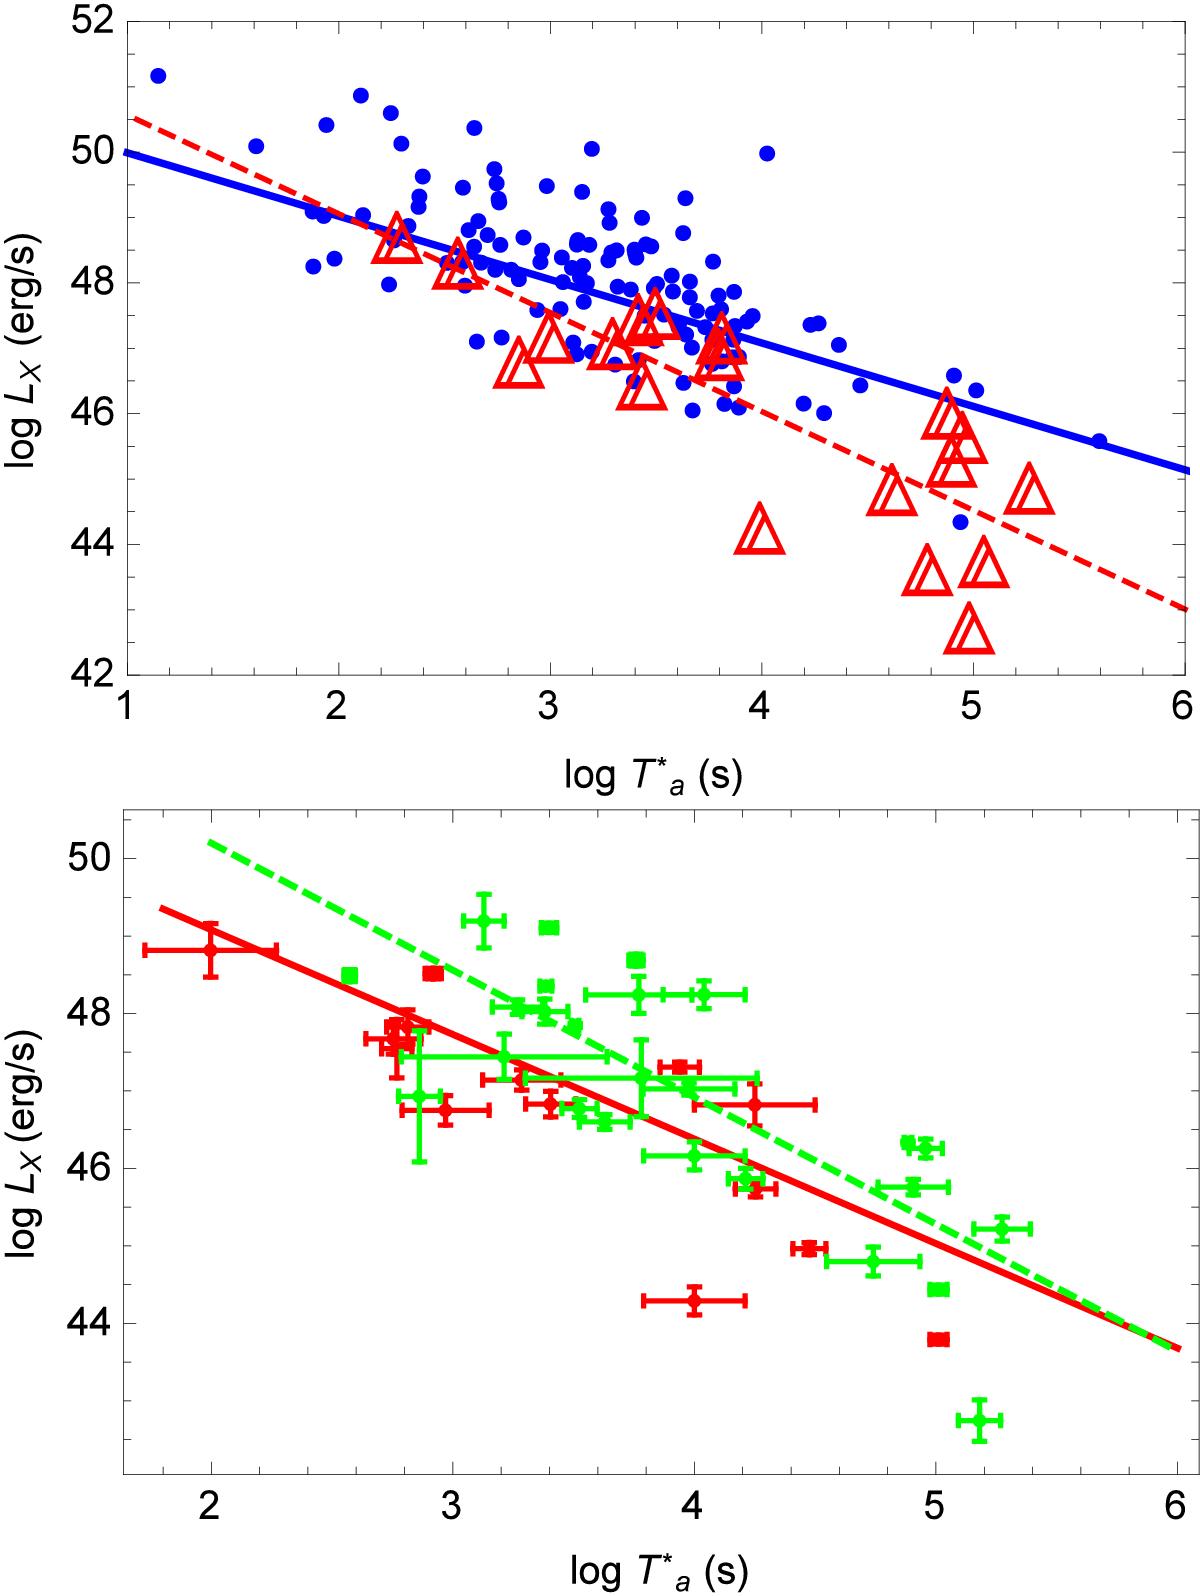
Analyzed log LX vs. ![]() distributions. Upper panel: LONG-NO-SNe 128 GRBs (blue points fitted with a solid blue line) and the 19 events from LONG-SNe (red empty triangles) fitted with a red dashed line. Lower panel: XRFs (25) GRBs (green points fitted with a dashed green line), and SE (16) (red points) fitted with a red solid line.
distributions. Upper panel: LONG-NO-SNe 128 GRBs (blue points fitted with a solid blue line) and the 19 events from LONG-SNe (red empty triangles) fitted with a red dashed line. Lower panel: XRFs (25) GRBs (green points fitted with a dashed green line), and SE (16) (red points) fitted with a red solid line.
Current usage metrics show cumulative count of Article Views (full-text article views including HTML views, PDF and ePub downloads, according to the available data) and Abstracts Views on Vision4Press platform.
Data correspond to usage on the plateform after 2015. The current usage metrics is available 48-96 hours after online publication and is updated daily on week days.
Initial download of the metrics may take a while.