Fig. 6
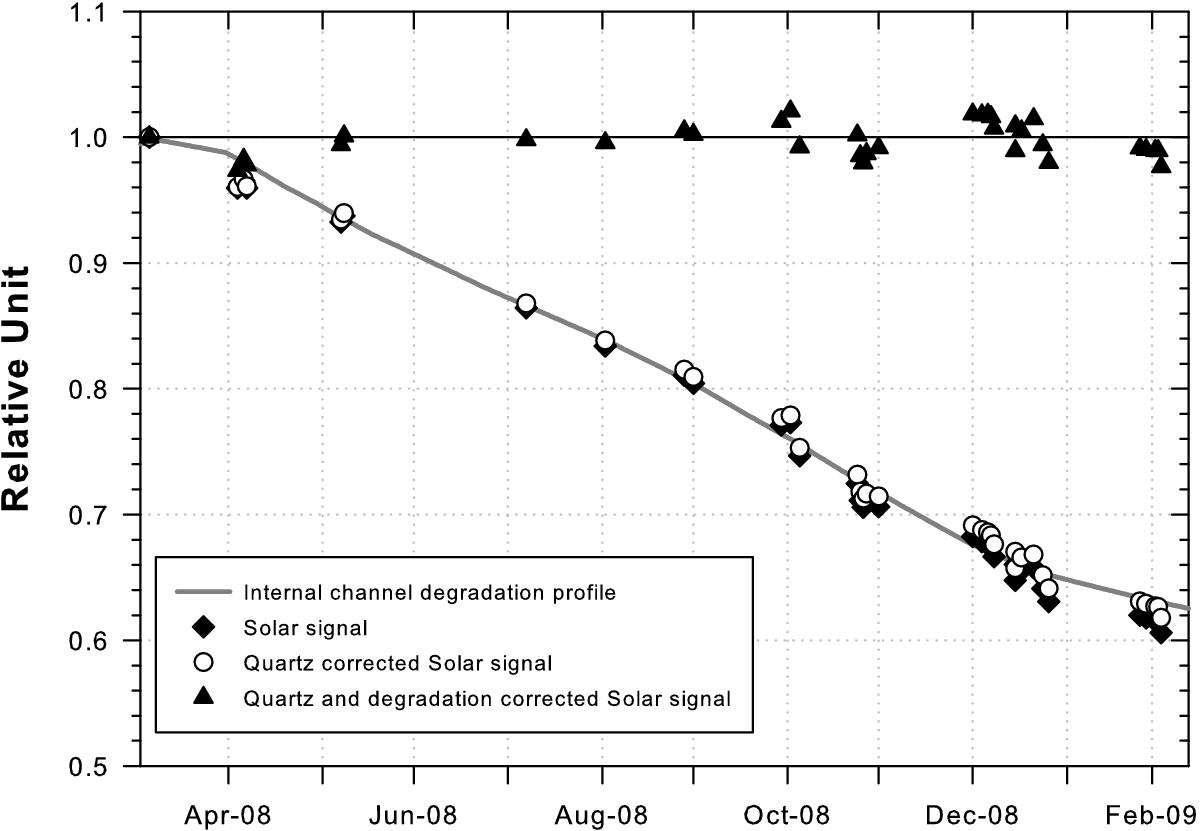
Degradation correction of the SOLAR/SOLSPEC UV channel response for the wavelength 210 nm. The diamonds and white dots show the measured solar signal before and after the quartz plate correction respectively. The triangles represent the solar signal corrected by the gray curve, i.e., the result of the deuterium lamps correction method.
Current usage metrics show cumulative count of Article Views (full-text article views including HTML views, PDF and ePub downloads, according to the available data) and Abstracts Views on Vision4Press platform.
Data correspond to usage on the plateform after 2015. The current usage metrics is available 48-96 hours after online publication and is updated daily on week days.
Initial download of the metrics may take a while.