Fig. 11
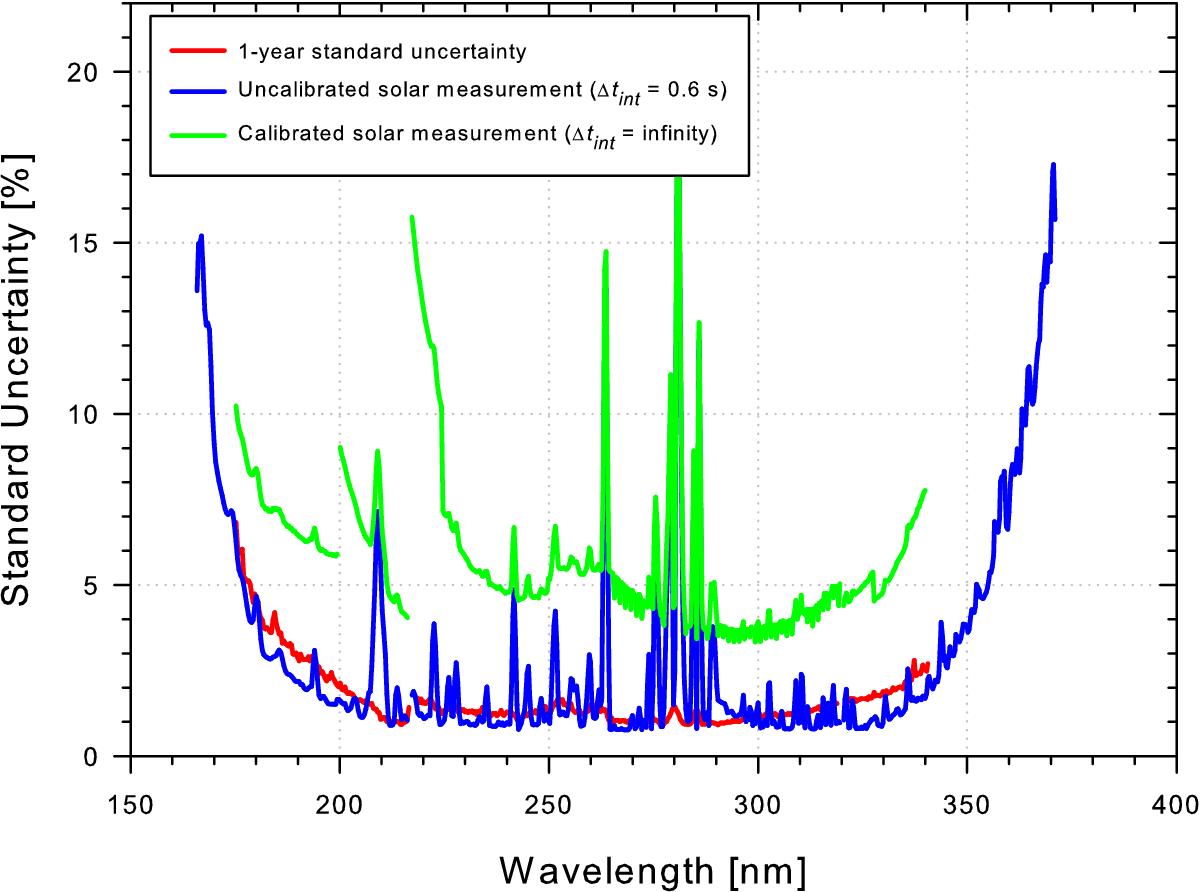
Comparison between calculated uncertainties and the standard deviation of real solar measurements: the CSU (%) for a SSI measurement with infinite integration time (blue); the calculated CSU for a SSI uncalibrated measurement with an integration time of 0.6 s and no uncertainty contribution from the response curve (green); and the measured standard deviation of the uncalibrated SOLAR/SOLSPEC as observed from a single solar measurement using a 0.6 s integration time (red).
Current usage metrics show cumulative count of Article Views (full-text article views including HTML views, PDF and ePub downloads, according to the available data) and Abstracts Views on Vision4Press platform.
Data correspond to usage on the plateform after 2015. The current usage metrics is available 48-96 hours after online publication and is updated daily on week days.
Initial download of the metrics may take a while.