Fig. 10
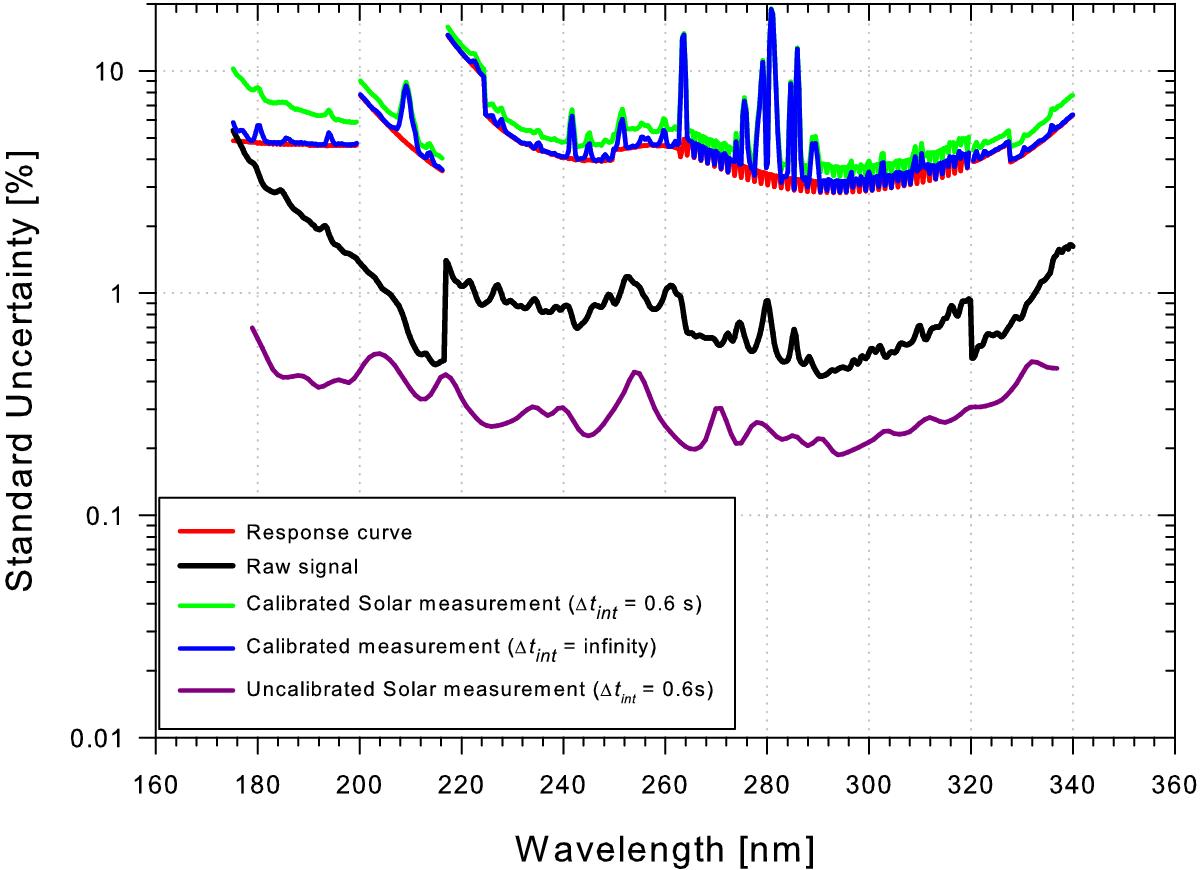
Combined standard uncertainties for UV SSI measurements: the CSU for the response curve (red); the CSU for the raw, uncalibrated signal – which is mainly the photon noise (black); and the CSU for SSI measured with a 0.6 s integration time (green); and the same for an infinite integration time (blue). Magenta is the baseline of the blue curve subtracted from the contribution of the response curve.
Current usage metrics show cumulative count of Article Views (full-text article views including HTML views, PDF and ePub downloads, according to the available data) and Abstracts Views on Vision4Press platform.
Data correspond to usage on the plateform after 2015. The current usage metrics is available 48-96 hours after online publication and is updated daily on week days.
Initial download of the metrics may take a while.