Fig. 7
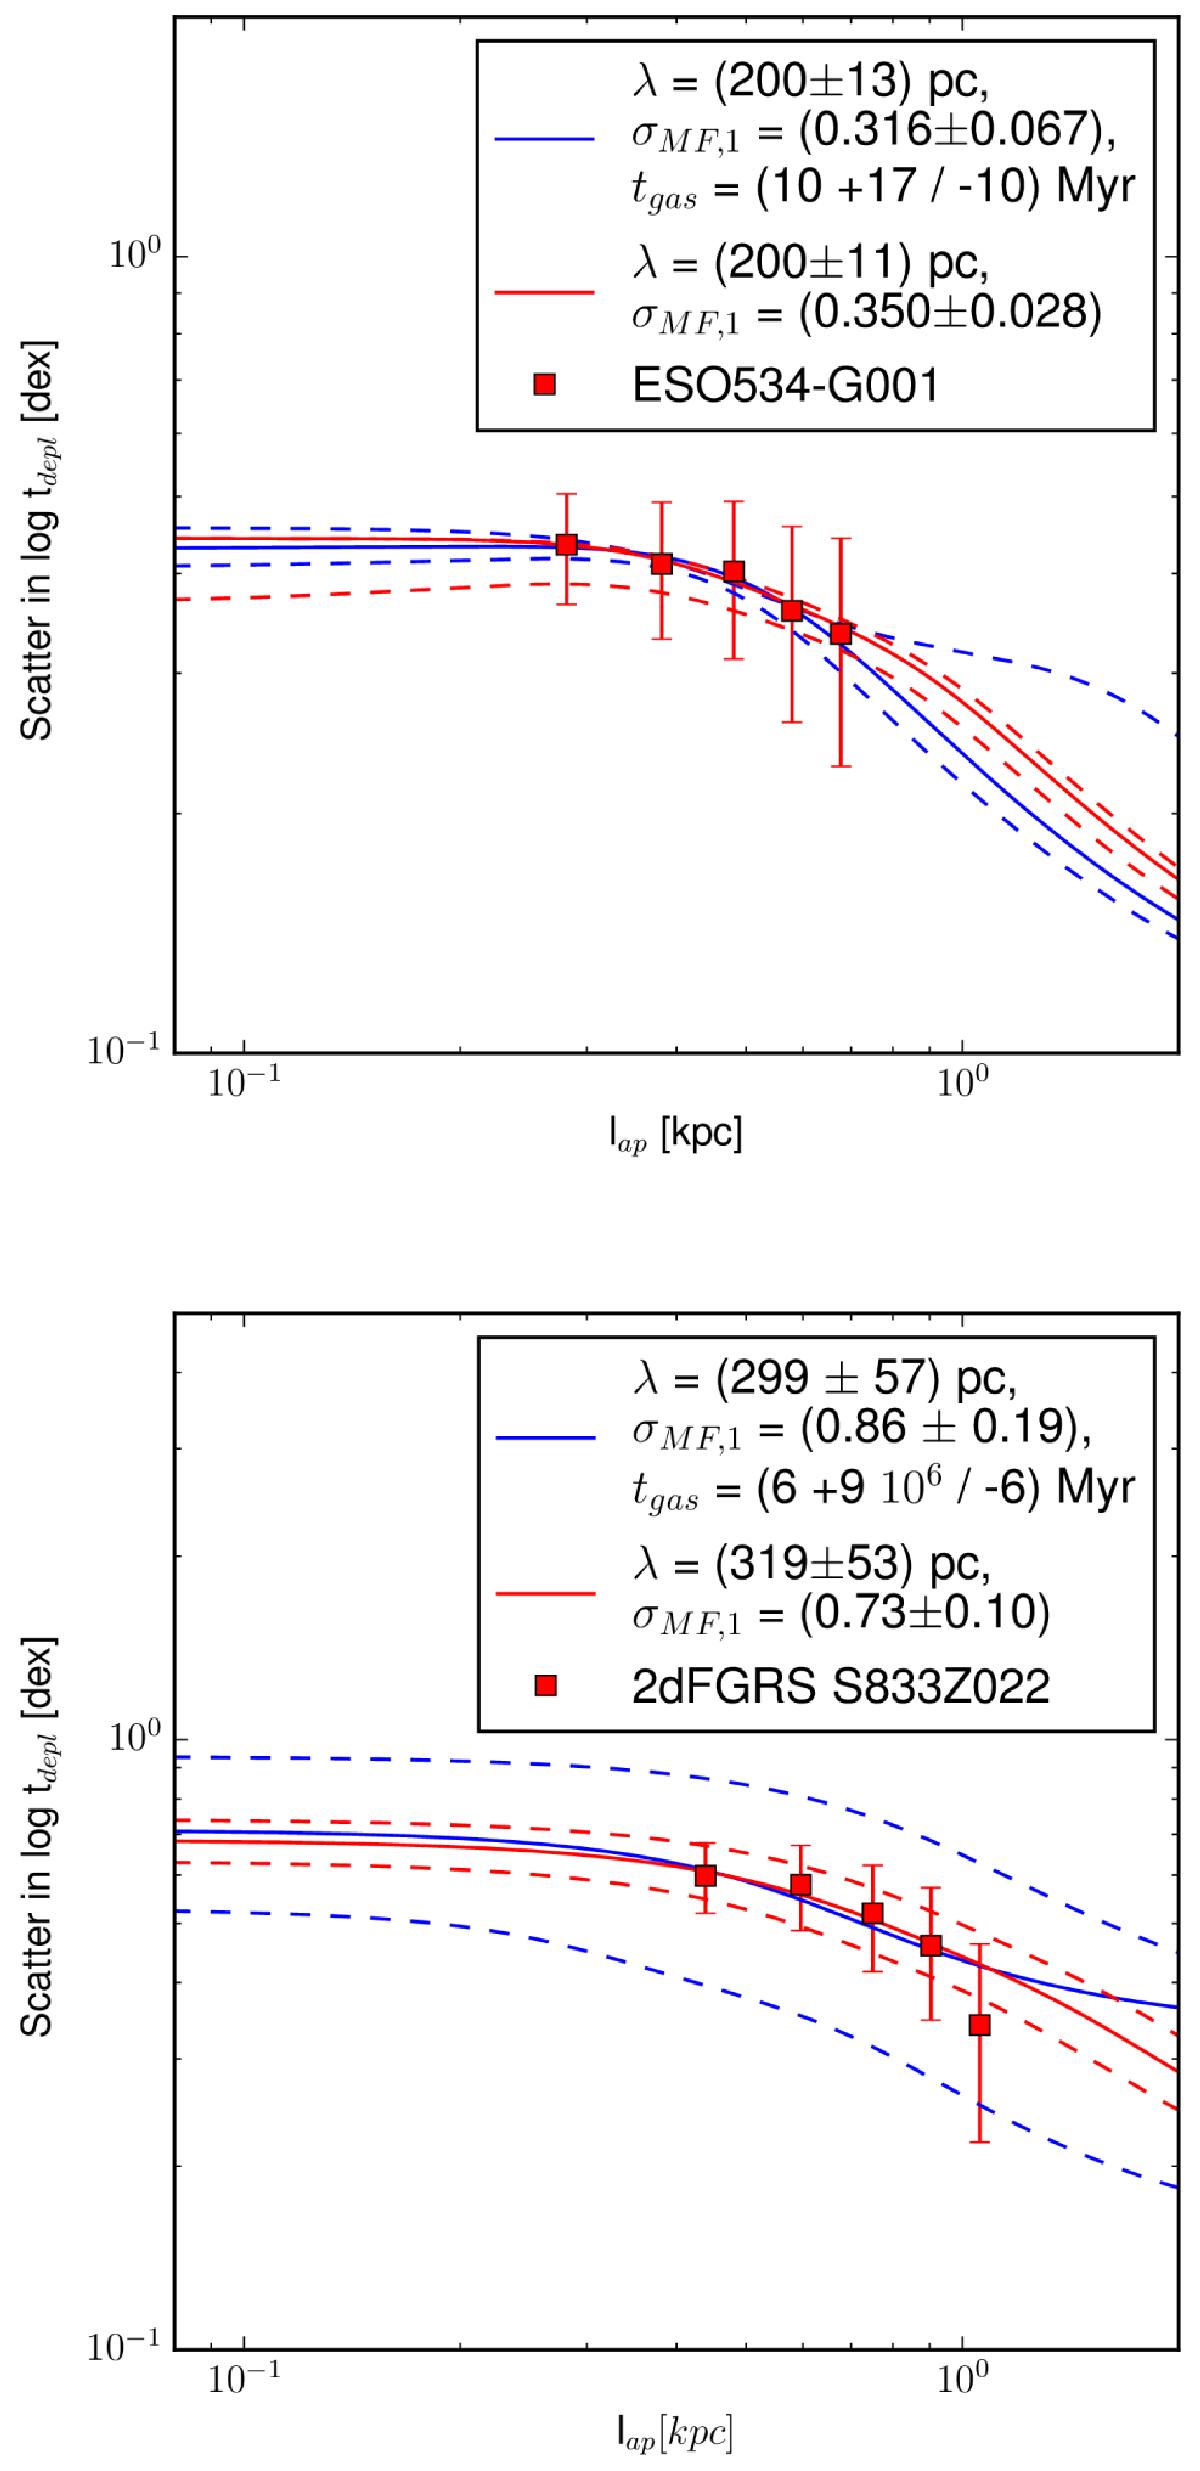
Scatter in gas depletion time σ(log tdepl) as a function of aperture size for GalA (top) and GalB (bottom). The solid curves are least-squares fits. The red lines are two-parameter fits, and the blue solid curves are three-parameter fits, where the determined parameters and uncertainties are given in the legend. For the red curves tgas is kept fixed at 25 Myr. For the dashed curves the minimum/maximum parameter values of each fit are used to give an error interval.
Current usage metrics show cumulative count of Article Views (full-text article views including HTML views, PDF and ePub downloads, according to the available data) and Abstracts Views on Vision4Press platform.
Data correspond to usage on the plateform after 2015. The current usage metrics is available 48-96 hours after online publication and is updated daily on week days.
Initial download of the metrics may take a while.