Fig. 6
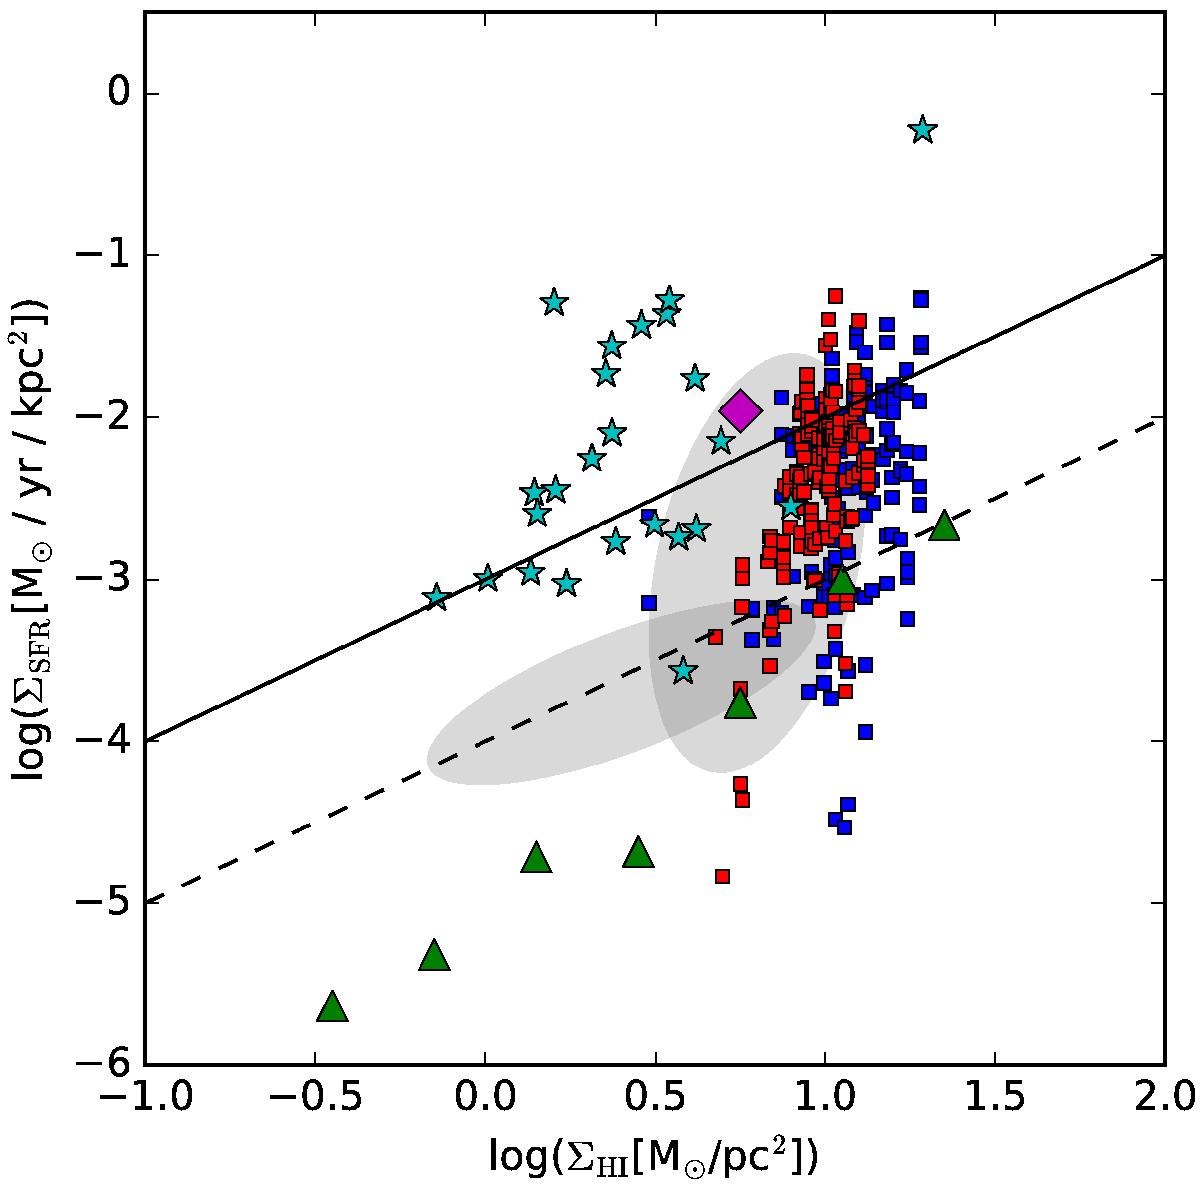
Schmidt-Kennicutt plot for the total amount of gas. The green triangles are the average ΣSFR within ΣHI bins of 400 pc sized regions within a sample of dwarf galaxies presented by Roychowdhury et al. (2015), the magenta diamond shows data from the LMC (Staveley-Smith et al. 2003), the cyan stars are disc averages of local dwarf galaxies from the LITTLE THINGS Survey (Zhang et al. 2012), the grey shaded area represents the region in which the bulk of the spatially resolved data points from local spiral galaxies presented by Bigiel et al. (2008) at a resolution of 750 pc lie, and the blue and red squares are the spatially resolved data points of GalA and GalB at the highest resolution, respectively. The solid and dashed lines represent lines of constant atomic gas depletion times, where solid is 1 Gyr and dashed 10 Gyr.
Current usage metrics show cumulative count of Article Views (full-text article views including HTML views, PDF and ePub downloads, according to the available data) and Abstracts Views on Vision4Press platform.
Data correspond to usage on the plateform after 2015. The current usage metrics is available 48-96 hours after online publication and is updated daily on week days.
Initial download of the metrics may take a while.