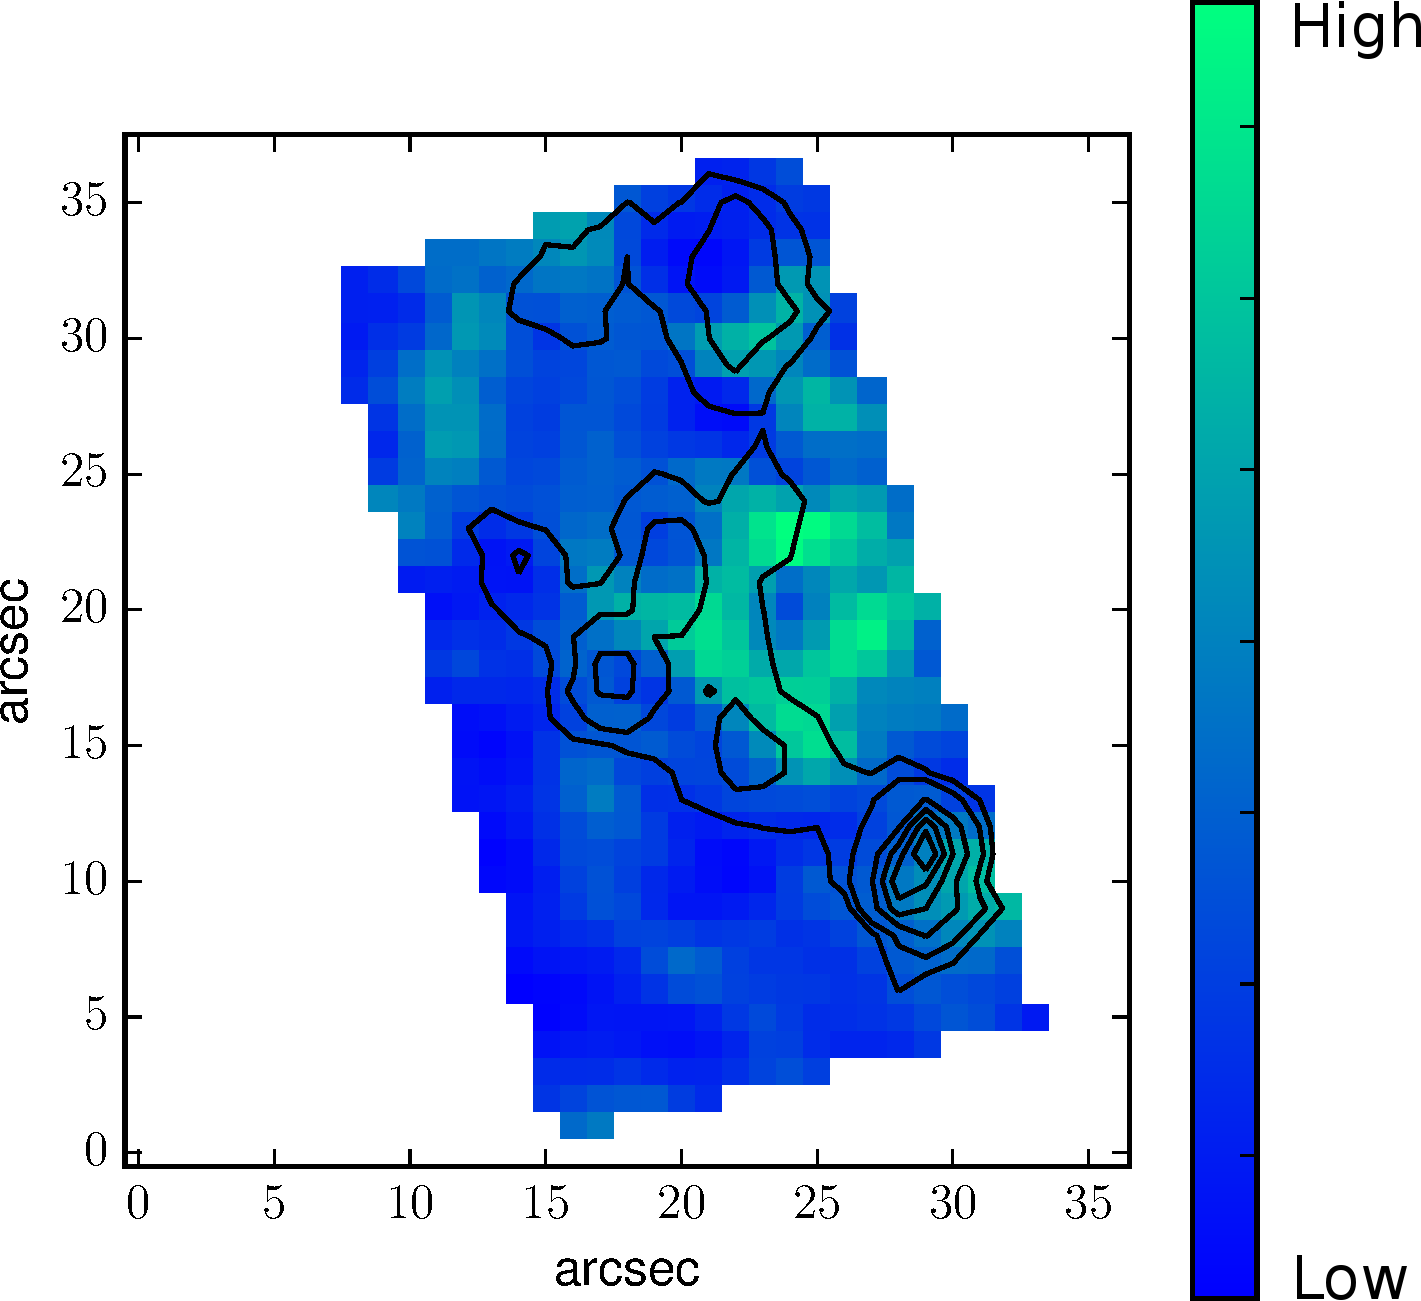
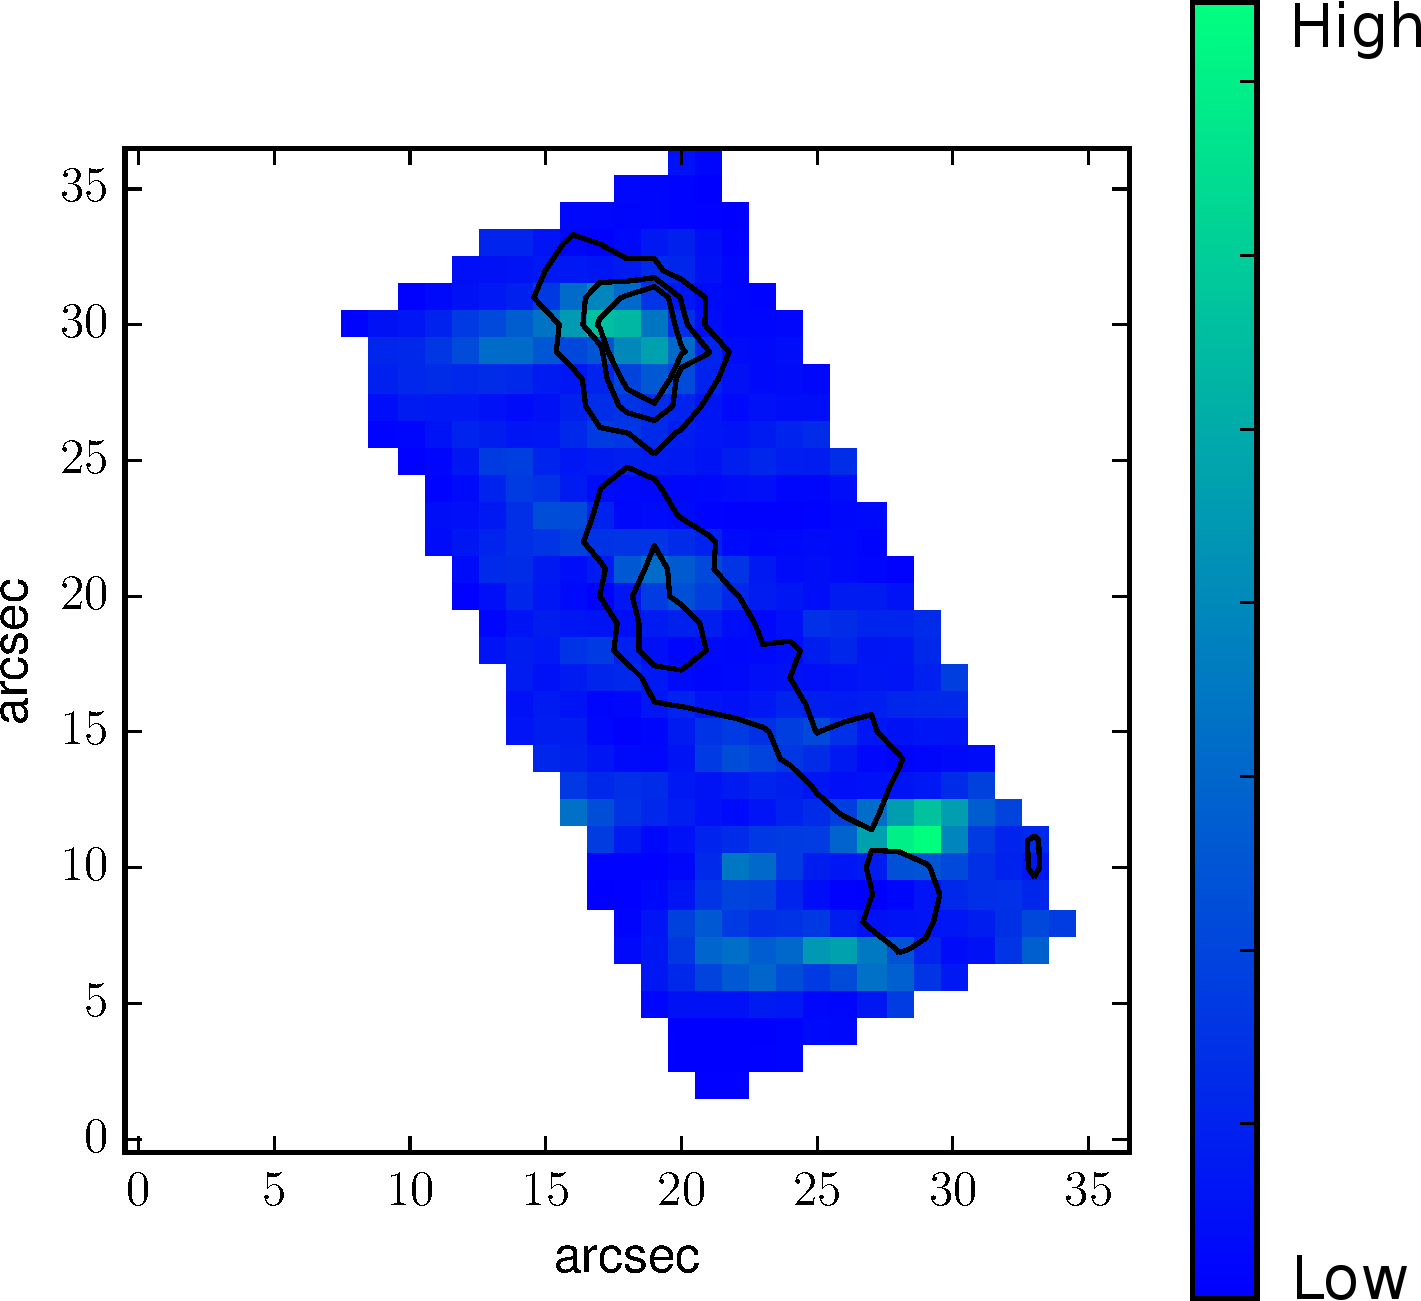
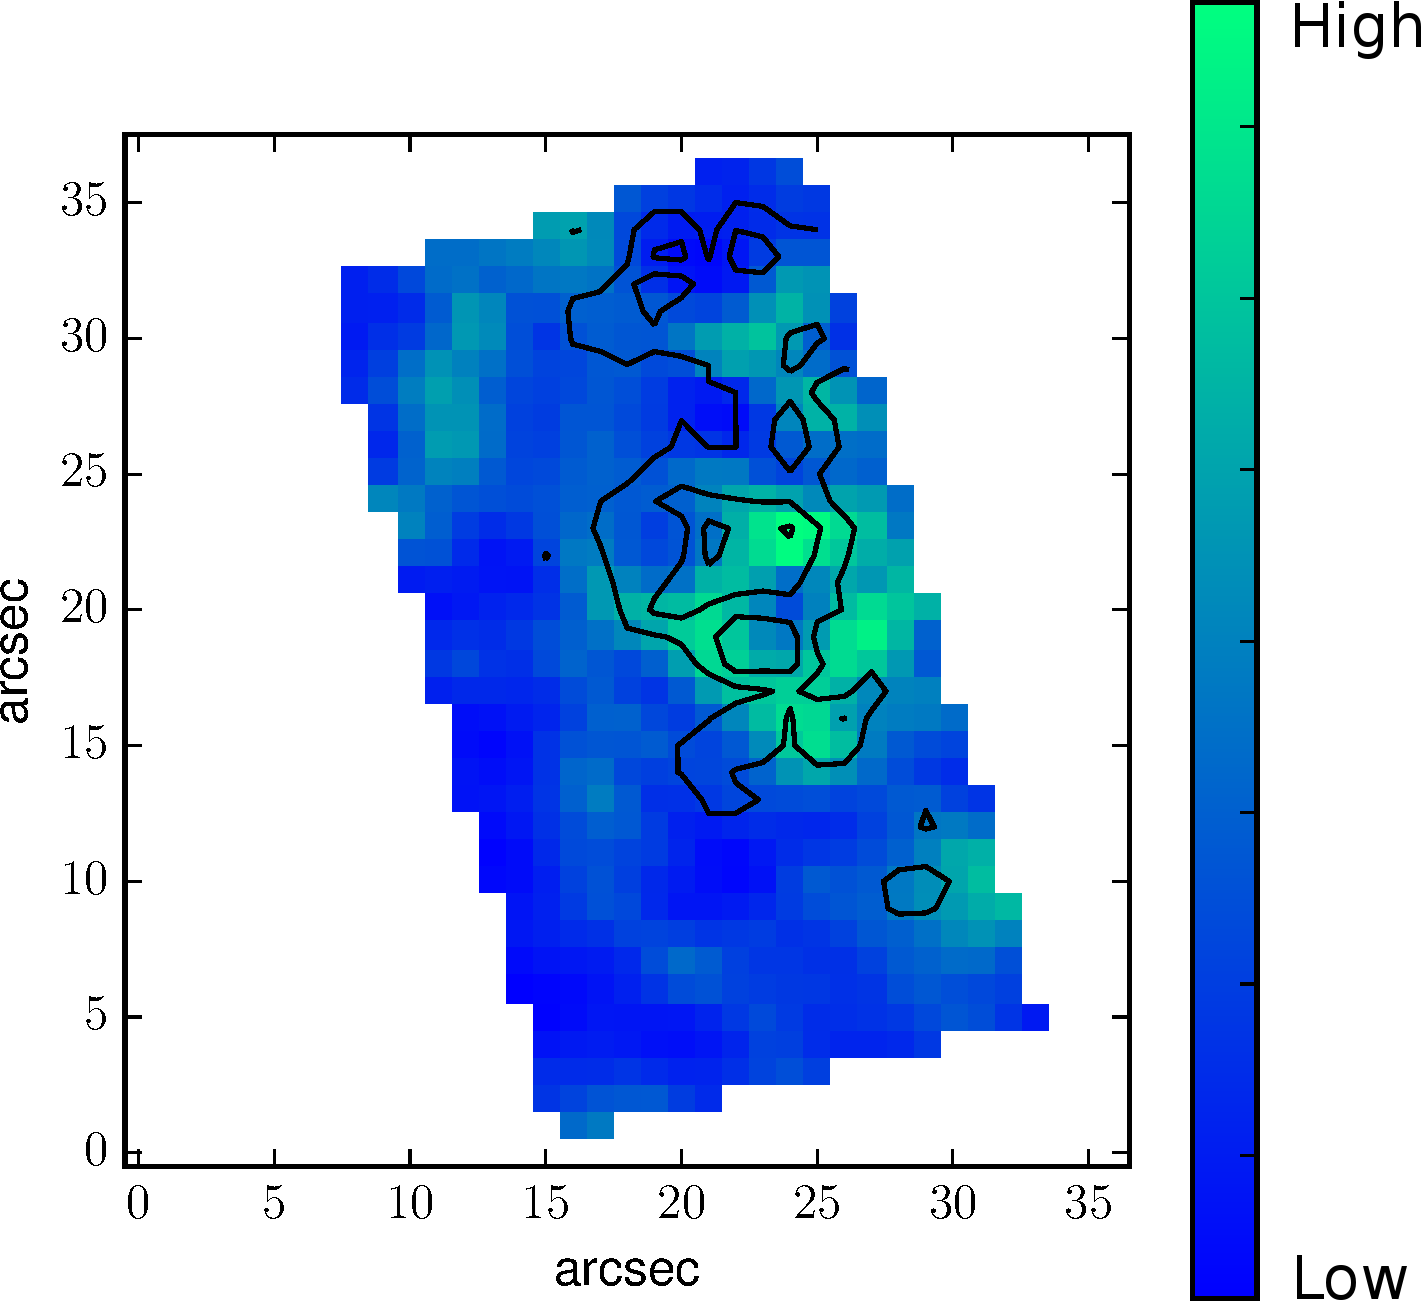
Fig. 4
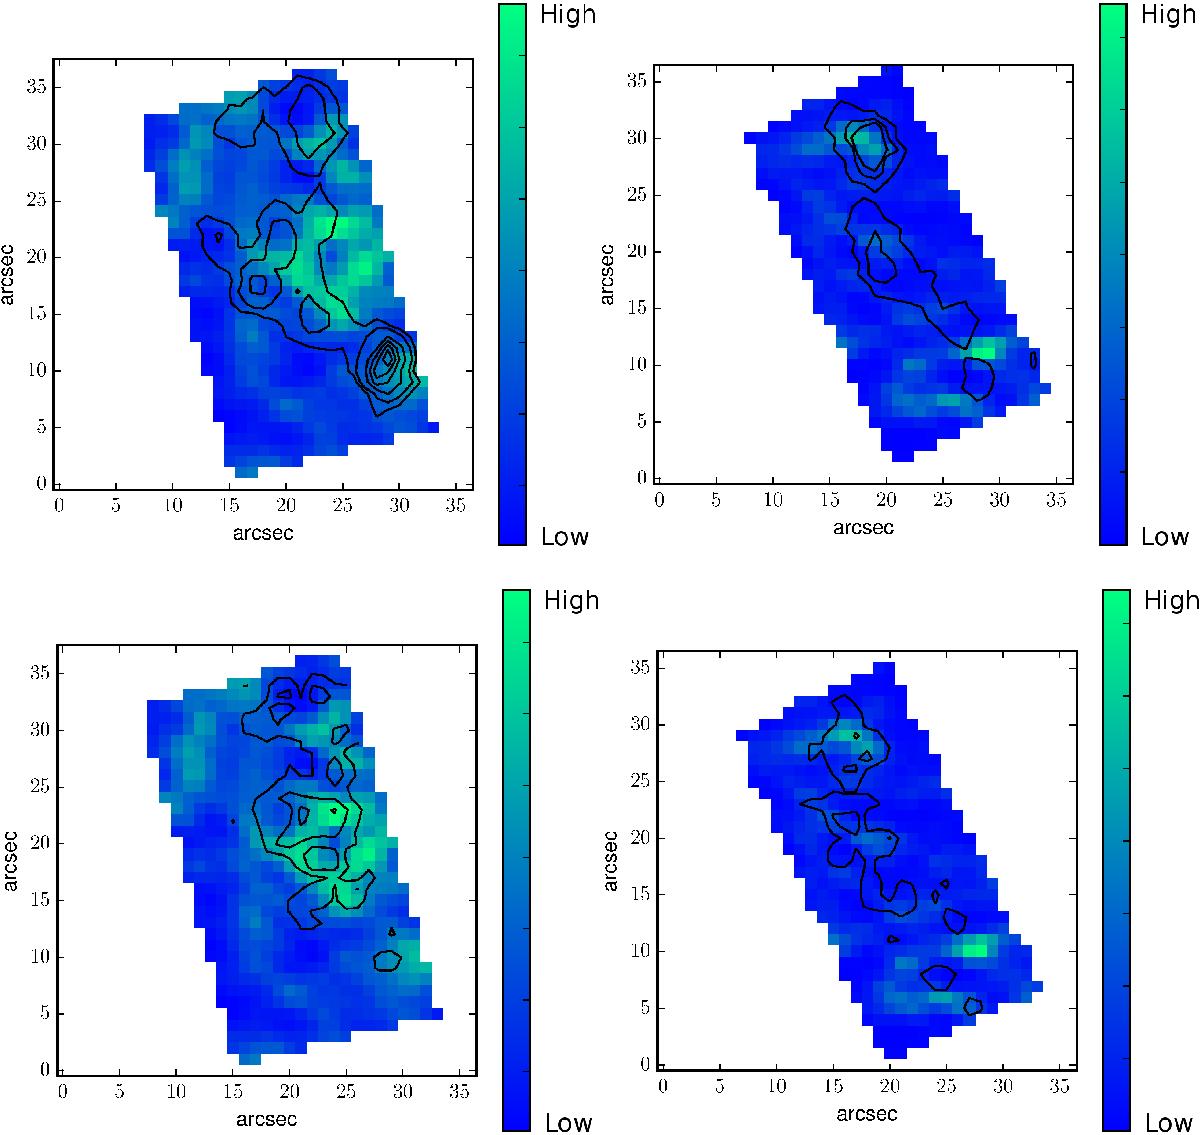
Maps of the pressure-based relative SFR of GalA (left) and GalB (right) and indicated by colour maps. Top: contours of the Hα emission at 3 × 10-16ergs-1cm-2 and from 5 to 20 × 10-16ergs-1cm-2 in steps of 5 × 10-16ergs-1cm-2 for GalA and at 5, 10, and 15 × 10-16ergs-1cm-2 for GalB over-plotted. Bottom: contours of the NUV emission from GALEX over-plotted on the same pressure-based SFR colour maps as in the top panels. The optical data cubes are aligned using the DSS observations and are therefore correct to ~1–2″.

Current usage metrics show cumulative count of Article Views (full-text article views including HTML views, PDF and ePub downloads, according to the available data) and Abstracts Views on Vision4Press platform.
Data correspond to usage on the plateform after 2015. The current usage metrics is available 48-96 hours after online publication and is updated daily on week days.
Initial download of the metrics may take a while.