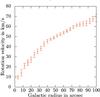
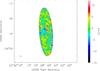
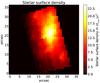
Fig. 1
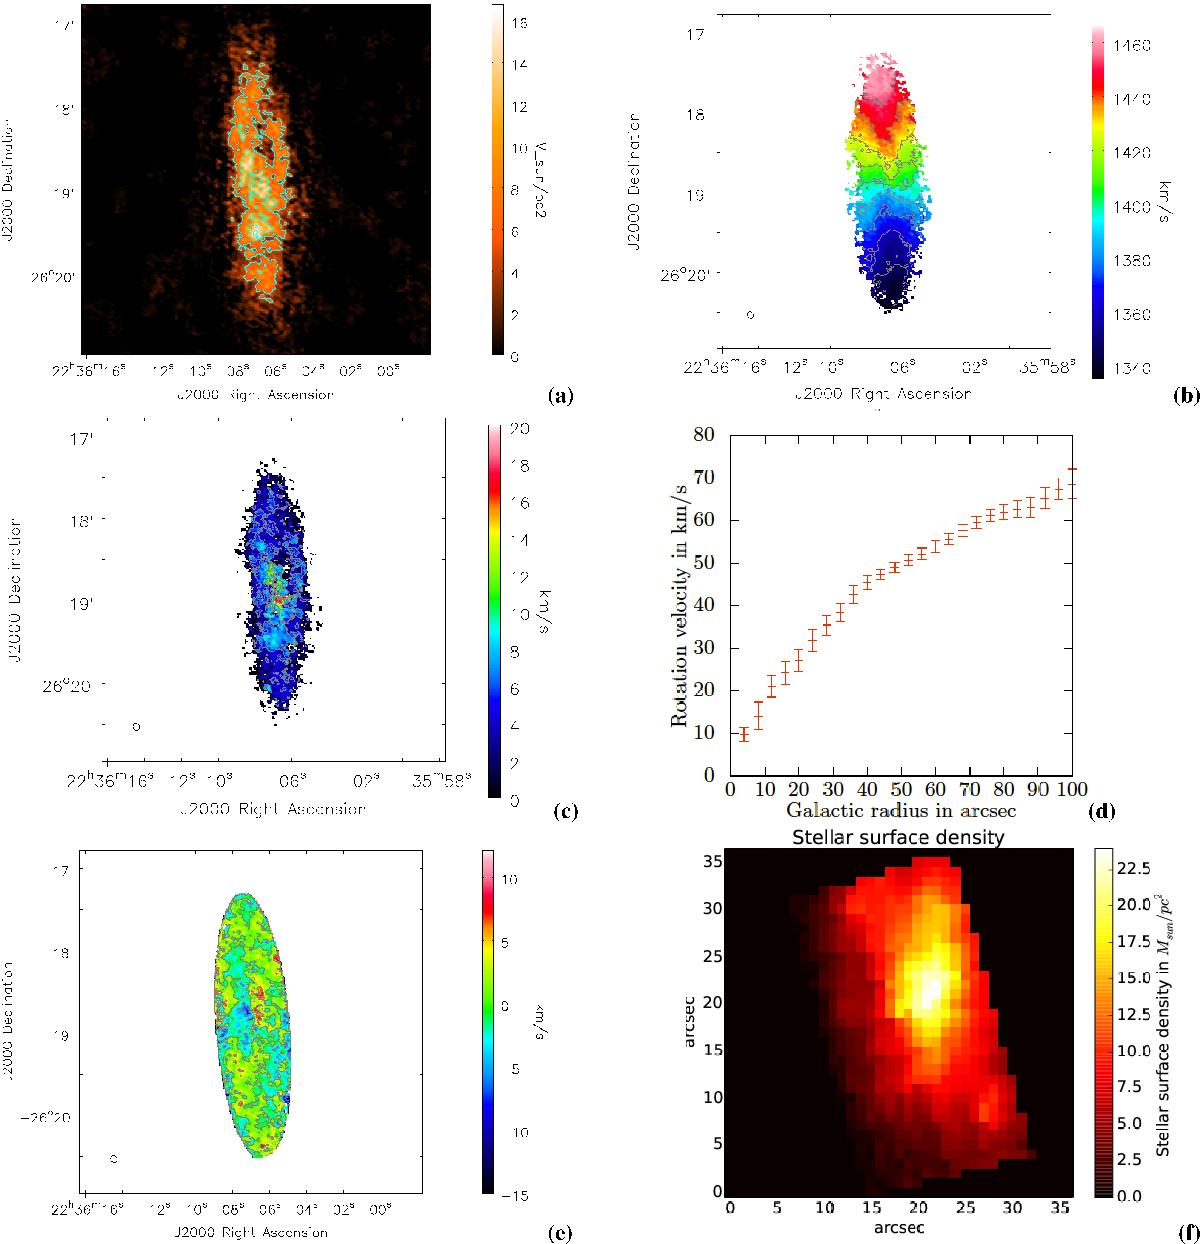
Results for GalA. a) HI surface density in M⊙ pc-2 from the combined VLA observations. The spacing between the contours is 5 M⊙ pc-2. b) Line-of-sight velocity map of HI observed using the VLA. The Δv spacing between the contours is 14 km s-1. c) Velocity dispersion map. The spacing between the contours is 5 km s-1. d) Rotation curve of the HI disc observed with the VLA. The curves are obtained from the tilted ring model described in the text. e): HI residual velocity field. The contours are at −10, 0 and 10 km s-1. f) Stellar surface density map obtained from the B-band luminosity determined from IFU observations and a colour-dependent mass-to-light ratio (Bell et al. 2003). In these maps, north is at the top and east is on the left-hand side.
Current usage metrics show cumulative count of Article Views (full-text article views including HTML views, PDF and ePub downloads, according to the available data) and Abstracts Views on Vision4Press platform.
Data correspond to usage on the plateform after 2015. The current usage metrics is available 48-96 hours after online publication and is updated daily on week days.
Initial download of the metrics may take a while.