Fig. 8
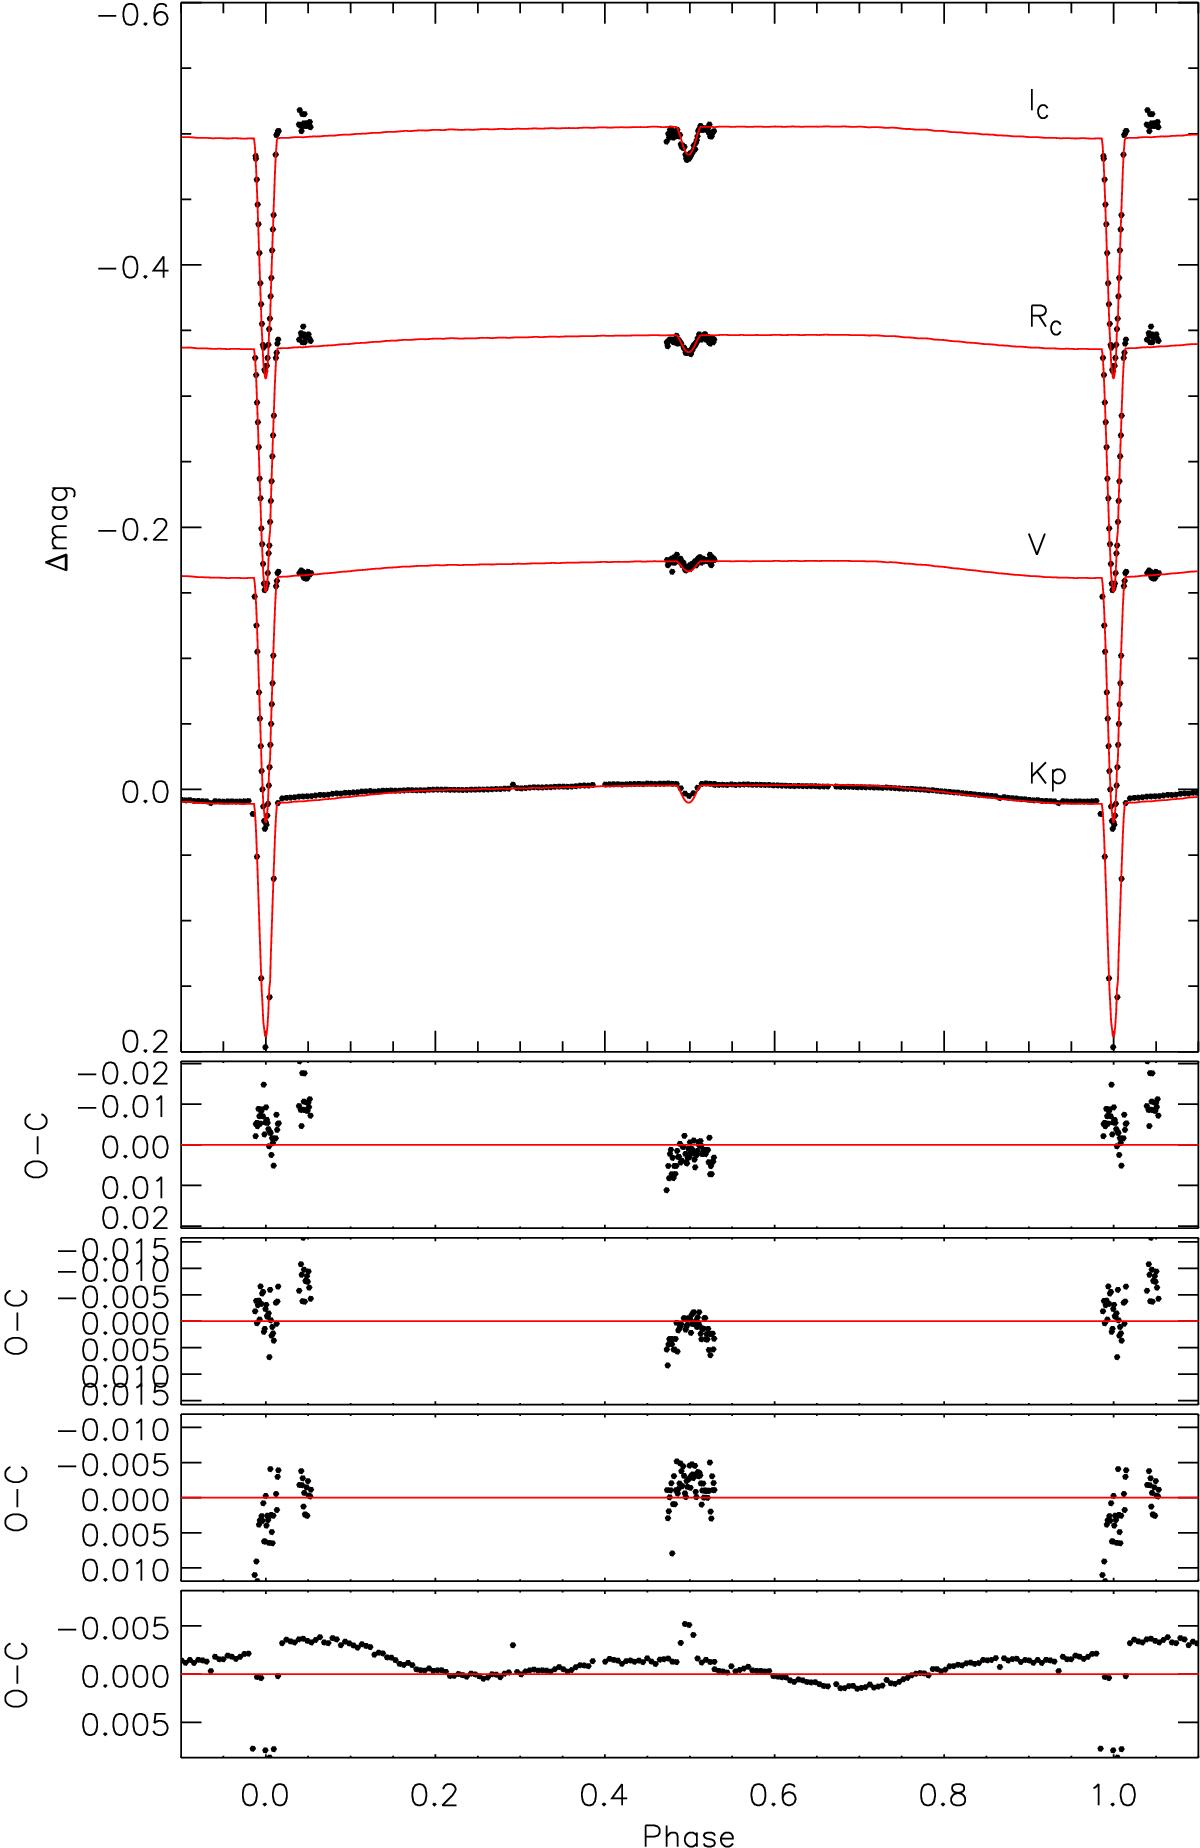
Light curves of the T-Cyg1-12664 in the epoch Q6-1 and fitted model with the parameters of the first column in Table 12. From top to bottom (upper panel), filters IC, RC, V, and Kepler band. The ground-based observations are displaced vertically to shrink the plot. The lower panels show the residuals of these fits in the same order.
Current usage metrics show cumulative count of Article Views (full-text article views including HTML views, PDF and ePub downloads, according to the available data) and Abstracts Views on Vision4Press platform.
Data correspond to usage on the plateform after 2015. The current usage metrics is available 48-96 hours after online publication and is updated daily on week days.
Initial download of the metrics may take a while.