Free Access
Fig. 7
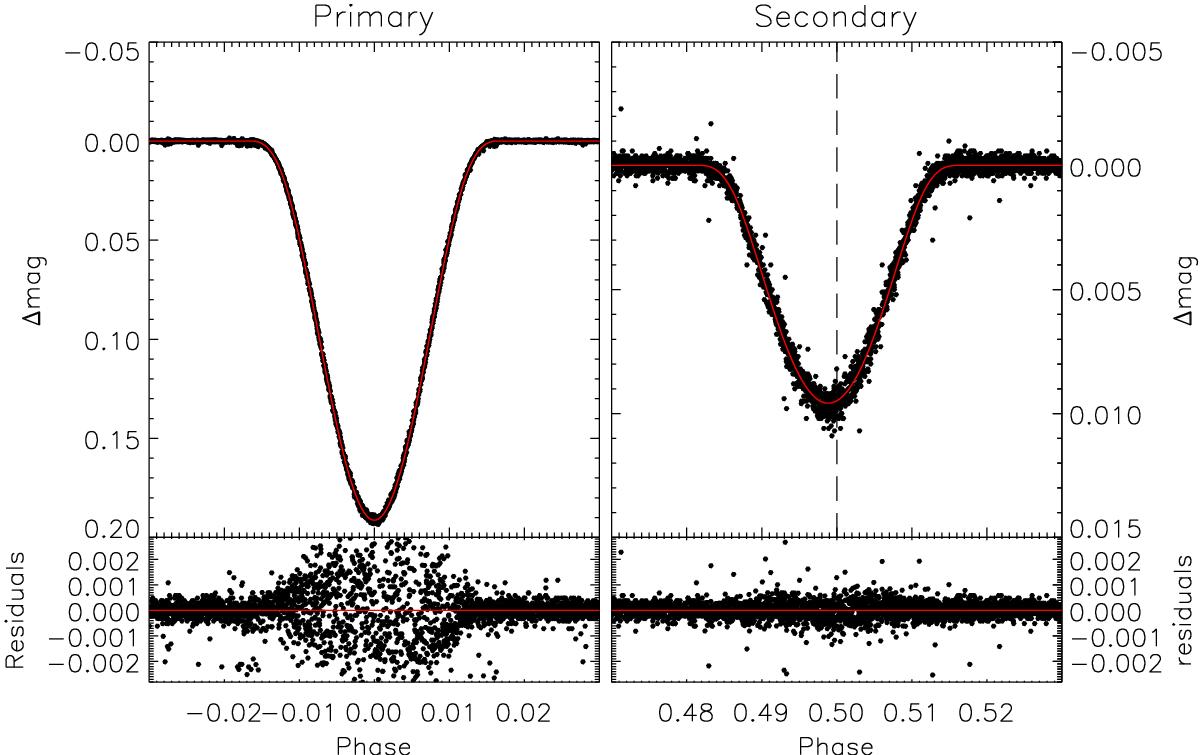
Detail of the Fig. 6 showing the fit in the eclipses. Note the change in the vertical scale in the two plots and the small displacement of the secondary eclipse from phase 0.5, indicated with a vertical dashed line.
Current usage metrics show cumulative count of Article Views (full-text article views including HTML views, PDF and ePub downloads, according to the available data) and Abstracts Views on Vision4Press platform.
Data correspond to usage on the plateform after 2015. The current usage metrics is available 48-96 hours after online publication and is updated daily on week days.
Initial download of the metrics may take a while.