Free Access
Fig. 4
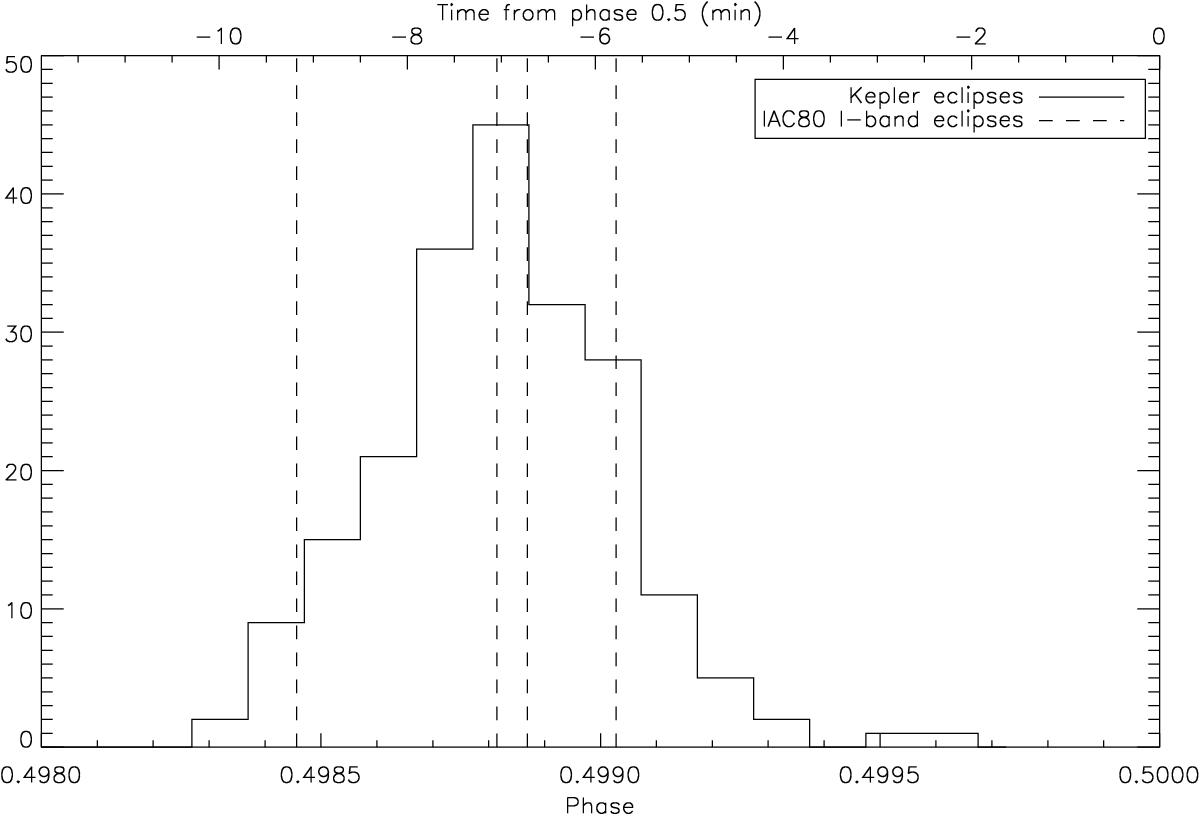
Histogram of the secondary eclipse distribution in phase (lower axis) and in time (upper axis). All the secondary eclipses are sistematically below phase 0.5. The vertical dashed lines show the position of the four IAC80 IC-band secondary eclipses.
Current usage metrics show cumulative count of Article Views (full-text article views including HTML views, PDF and ePub downloads, according to the available data) and Abstracts Views on Vision4Press platform.
Data correspond to usage on the plateform after 2015. The current usage metrics is available 48-96 hours after online publication and is updated daily on week days.
Initial download of the metrics may take a while.