Free Access
Fig. 2
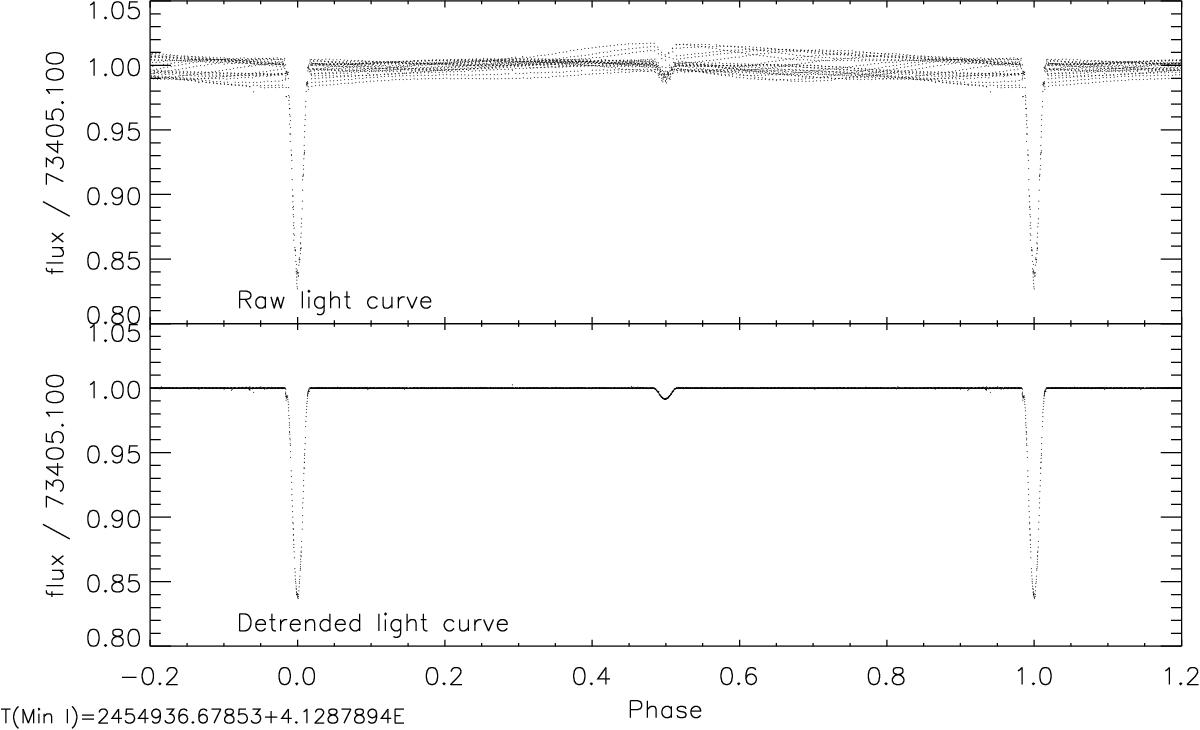
Effect of the detrending over the phased light curve of Q6 quarter. Upper panel shows the raw light curve and lower panel shows the light curve after applying the Legendre polynomial fitted in Fig. 1.
Current usage metrics show cumulative count of Article Views (full-text article views including HTML views, PDF and ePub downloads, according to the available data) and Abstracts Views on Vision4Press platform.
Data correspond to usage on the plateform after 2015. The current usage metrics is available 48-96 hours after online publication and is updated daily on week days.
Initial download of the metrics may take a while.