Fig. 10
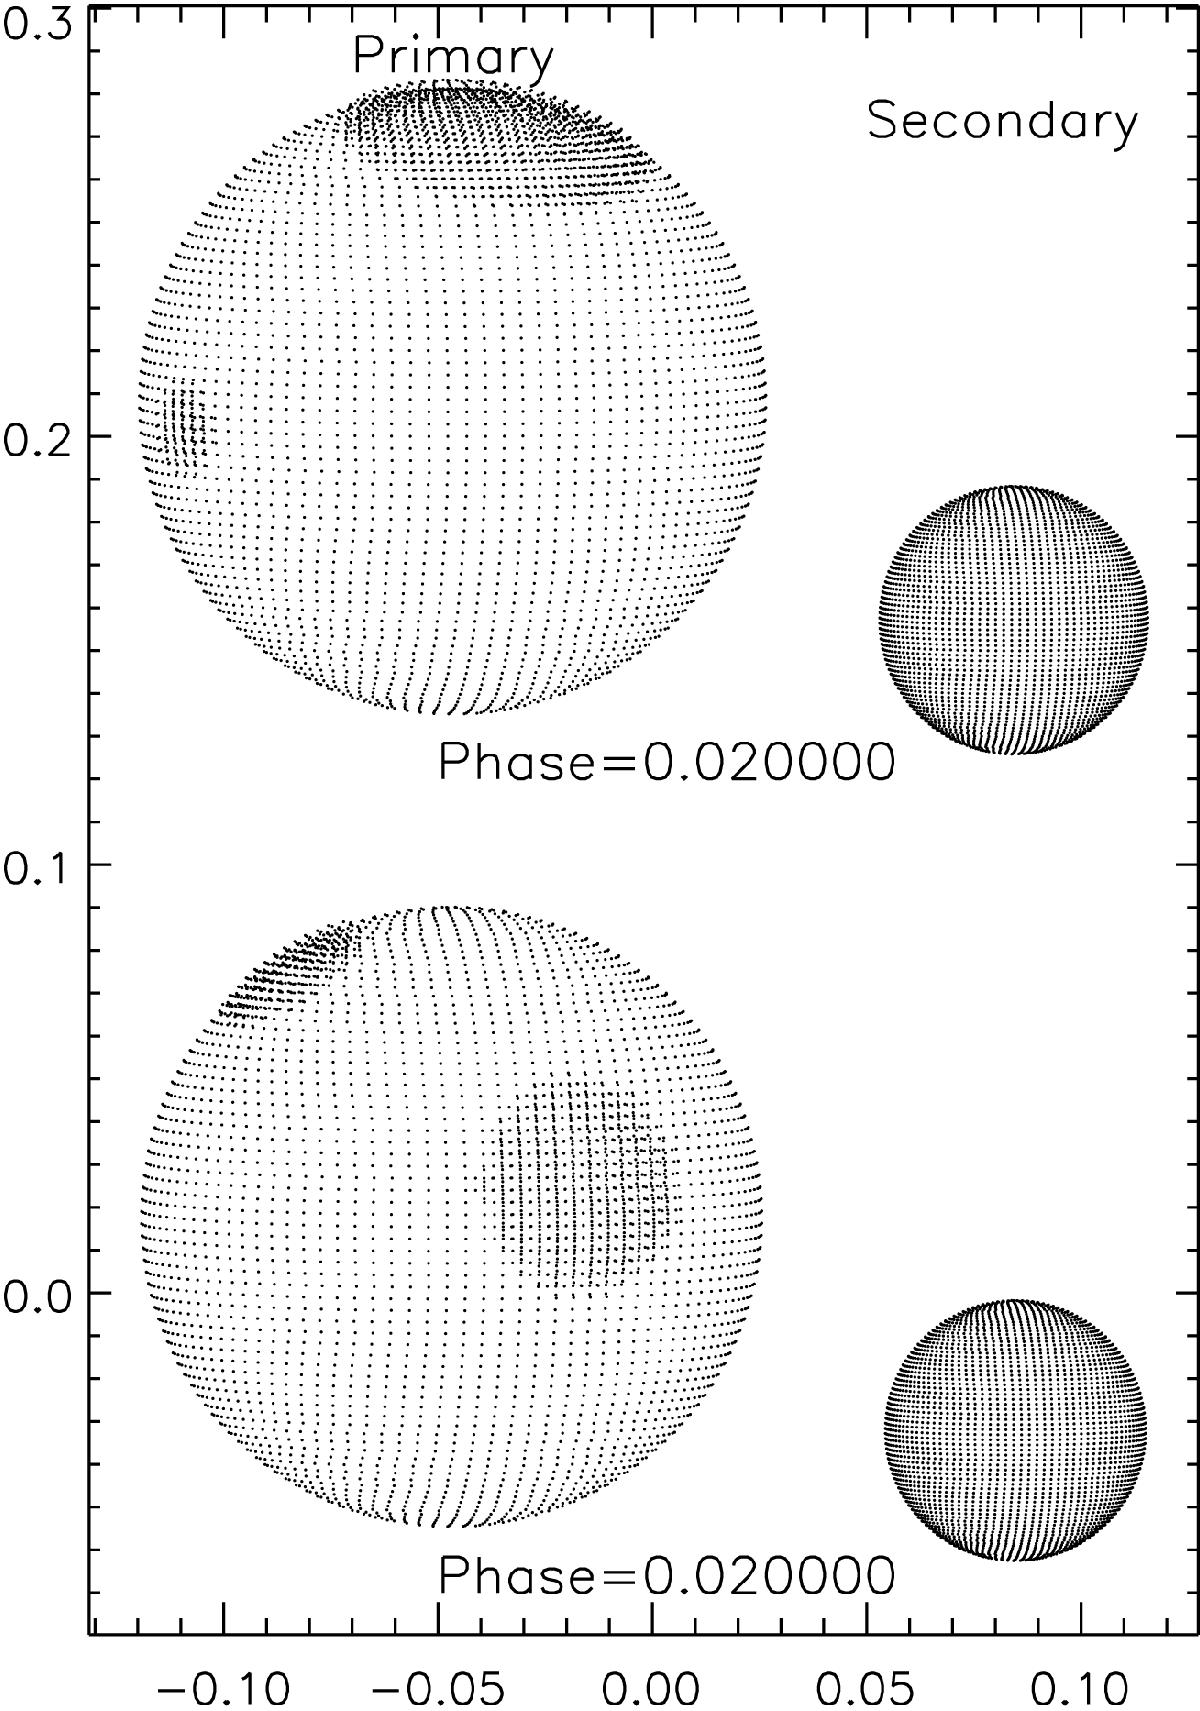
Representation of the spot configurations of T-Cyg1-12664 in the (v,w) plane for the two epochs analyzed: the lower plot is for the Q6-1 epoch and the upper plot is for the Q6-2 epoch, which is displaced by an offset of 0.2 in the w axis. Both axes have units of relative radius. The stars are represented at orbital phase 0.020, just after the primary eclipse, and the secondary star is orbiting towards the right side.
Current usage metrics show cumulative count of Article Views (full-text article views including HTML views, PDF and ePub downloads, according to the available data) and Abstracts Views on Vision4Press platform.
Data correspond to usage on the plateform after 2015. The current usage metrics is available 48-96 hours after online publication and is updated daily on week days.
Initial download of the metrics may take a while.