Free Access
Fig. 1
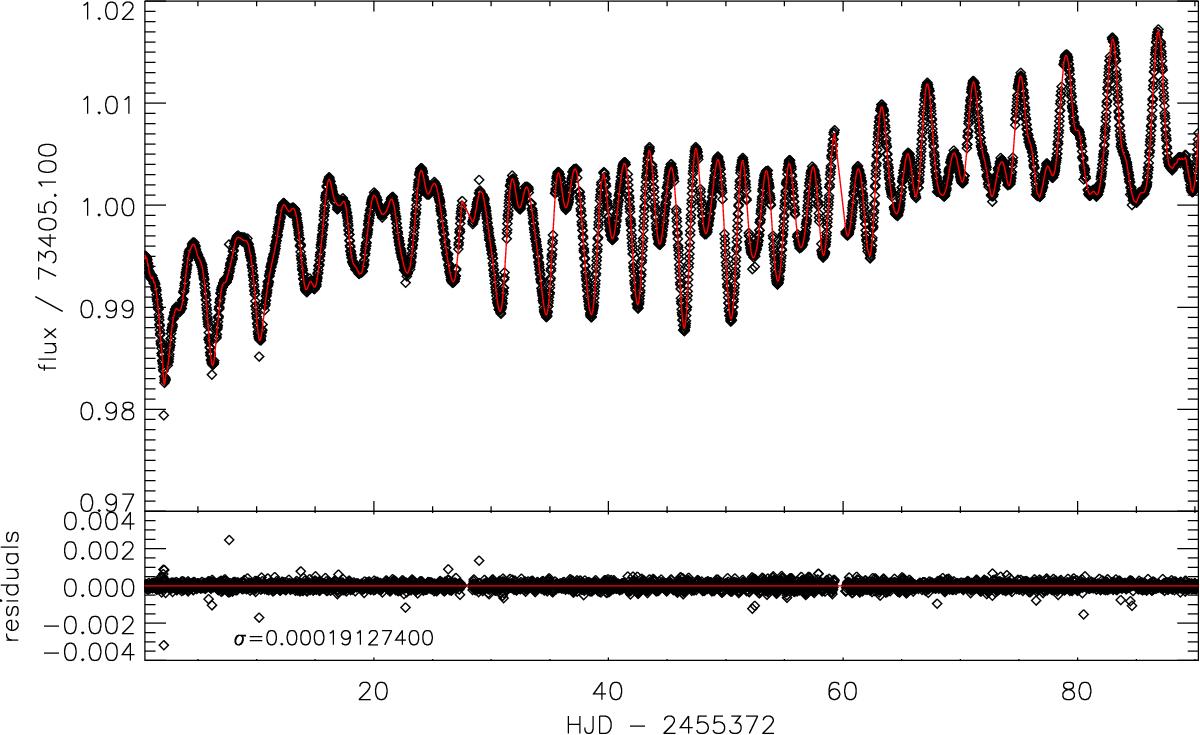
Fit of an order 300 Legendre polynomial to the Kepler data in quarter 6. The upper panel shows the out-of-eclipse light curve and the fit (red line). The lower panel shows the residuals of the fit.
Current usage metrics show cumulative count of Article Views (full-text article views including HTML views, PDF and ePub downloads, according to the available data) and Abstracts Views on Vision4Press platform.
Data correspond to usage on the plateform after 2015. The current usage metrics is available 48-96 hours after online publication and is updated daily on week days.
Initial download of the metrics may take a while.