Free Access
Fig. 11
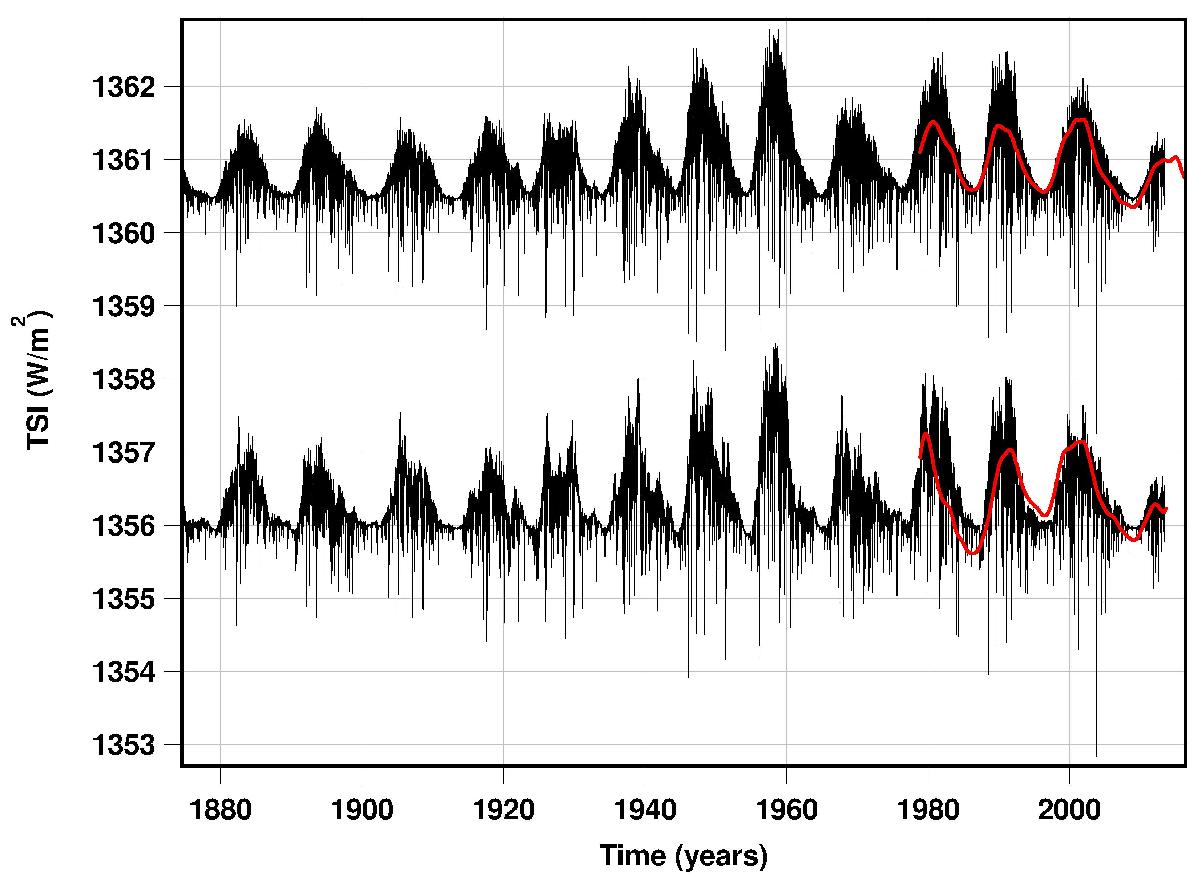
Hindcasting based on multicomponent models. PSI to PMOD mapping (upper curve) and PSI to ACRIM (shifted down by five units; lower curve). In red we plot the low-frequency backbones of the target curves. The cross correlation between the two hindcast curves is Rc = 0.941 (see Fig. 10d).
Current usage metrics show cumulative count of Article Views (full-text article views including HTML views, PDF and ePub downloads, according to the available data) and Abstracts Views on Vision4Press platform.
Data correspond to usage on the plateform after 2015. The current usage metrics is available 48-96 hours after online publication and is updated daily on week days.
Initial download of the metrics may take a while.