Free Access
Fig. 9
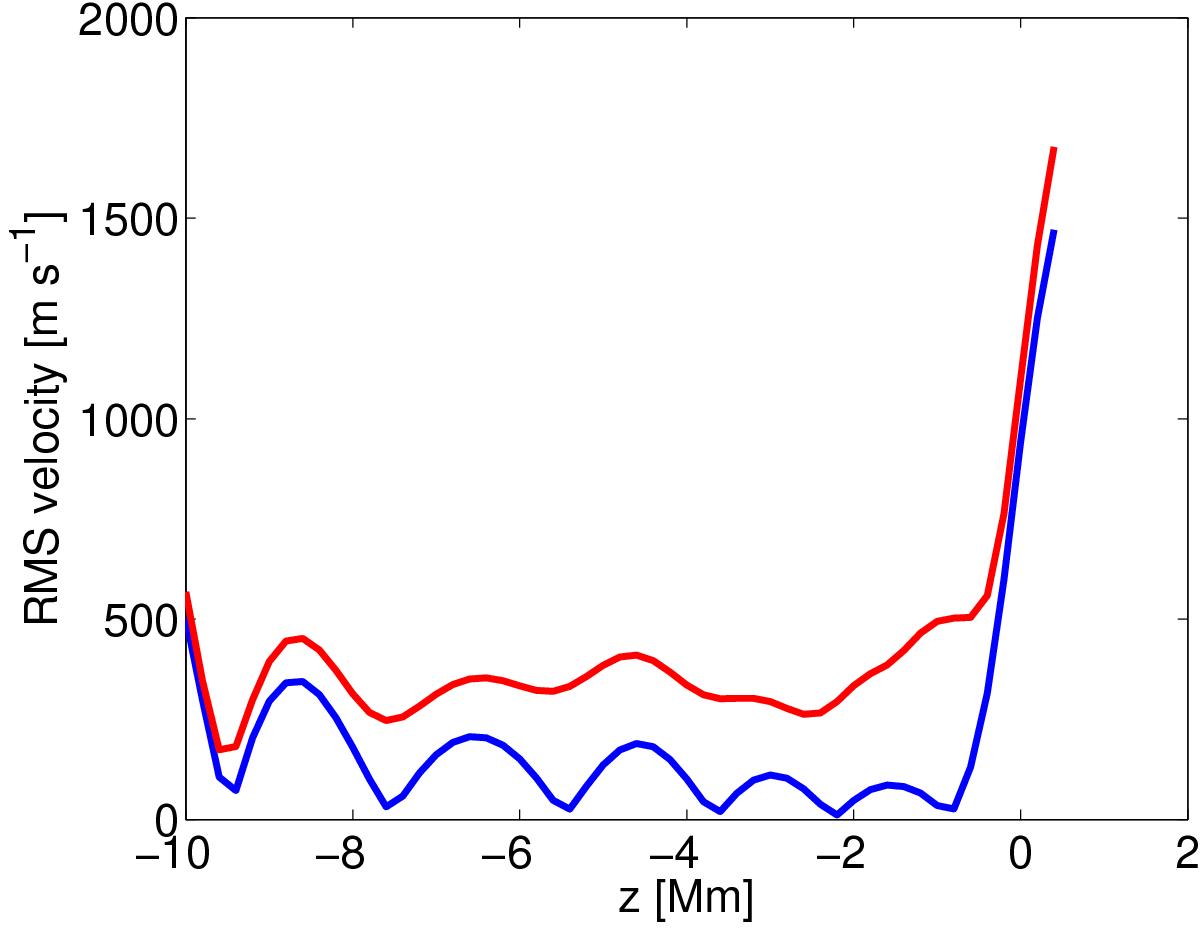
Level of random noise in the reconstructed flow (blue) and the RMS of the reconstructed flow (red). Both curves are plotted for the horizontal component of velocity and for the case with a S/N of 100. Obviously, the error increases beyond reasons at the ends of the domain.
Current usage metrics show cumulative count of Article Views (full-text article views including HTML views, PDF and ePub downloads, according to the available data) and Abstracts Views on Vision4Press platform.
Data correspond to usage on the plateform after 2015. The current usage metrics is available 48-96 hours after online publication and is updated daily on week days.
Initial download of the metrics may take a while.