Free Access
Fig. 8
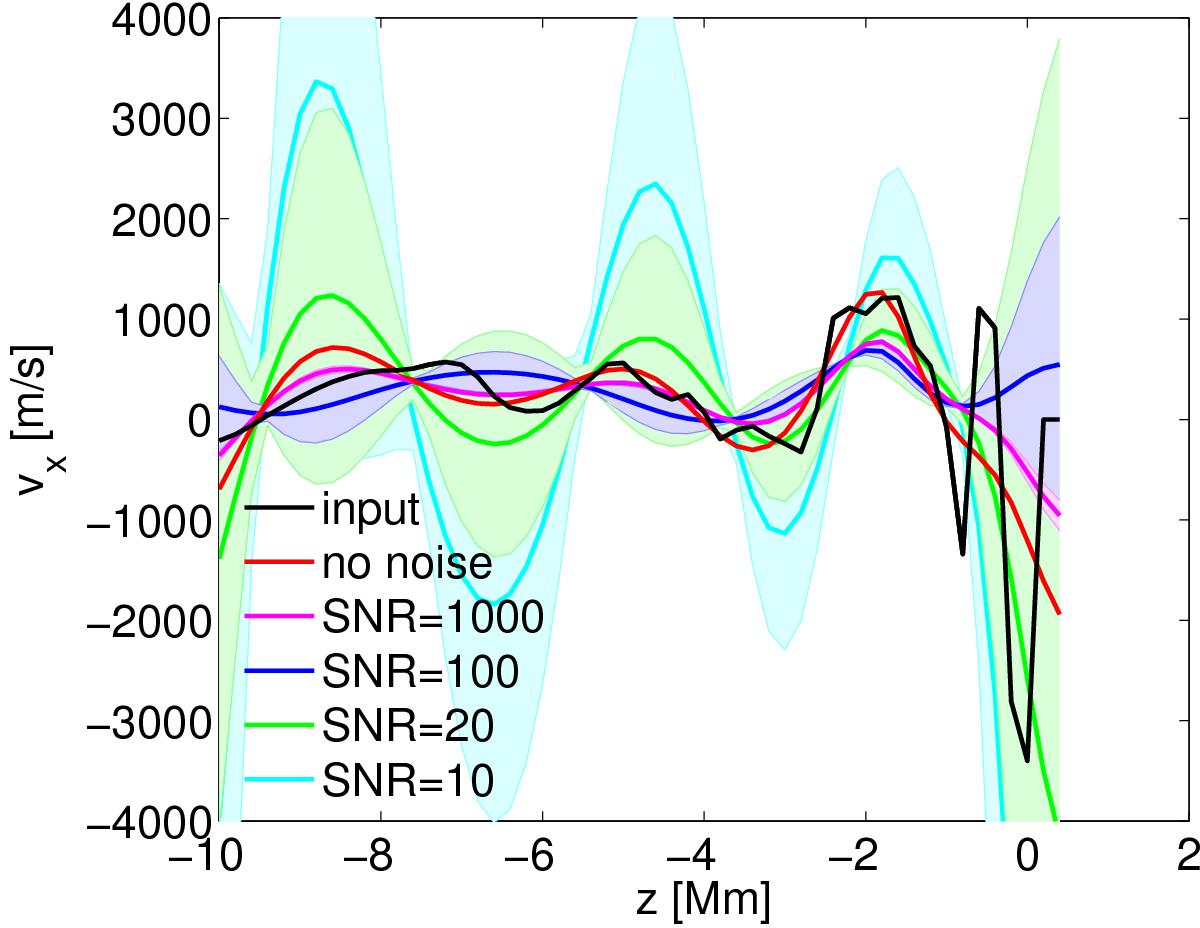
Cut through the horizontal flow component at one point for the input velocity field (black) and reconstructions with varying noise levels (coloured lines). The shaded regions indicate the respective error bars. Note that the black and red lines do not have errors.
Current usage metrics show cumulative count of Article Views (full-text article views including HTML views, PDF and ePub downloads, according to the available data) and Abstracts Views on Vision4Press platform.
Data correspond to usage on the plateform after 2015. The current usage metrics is available 48-96 hours after online publication and is updated daily on week days.
Initial download of the metrics may take a while.