Fig. 7
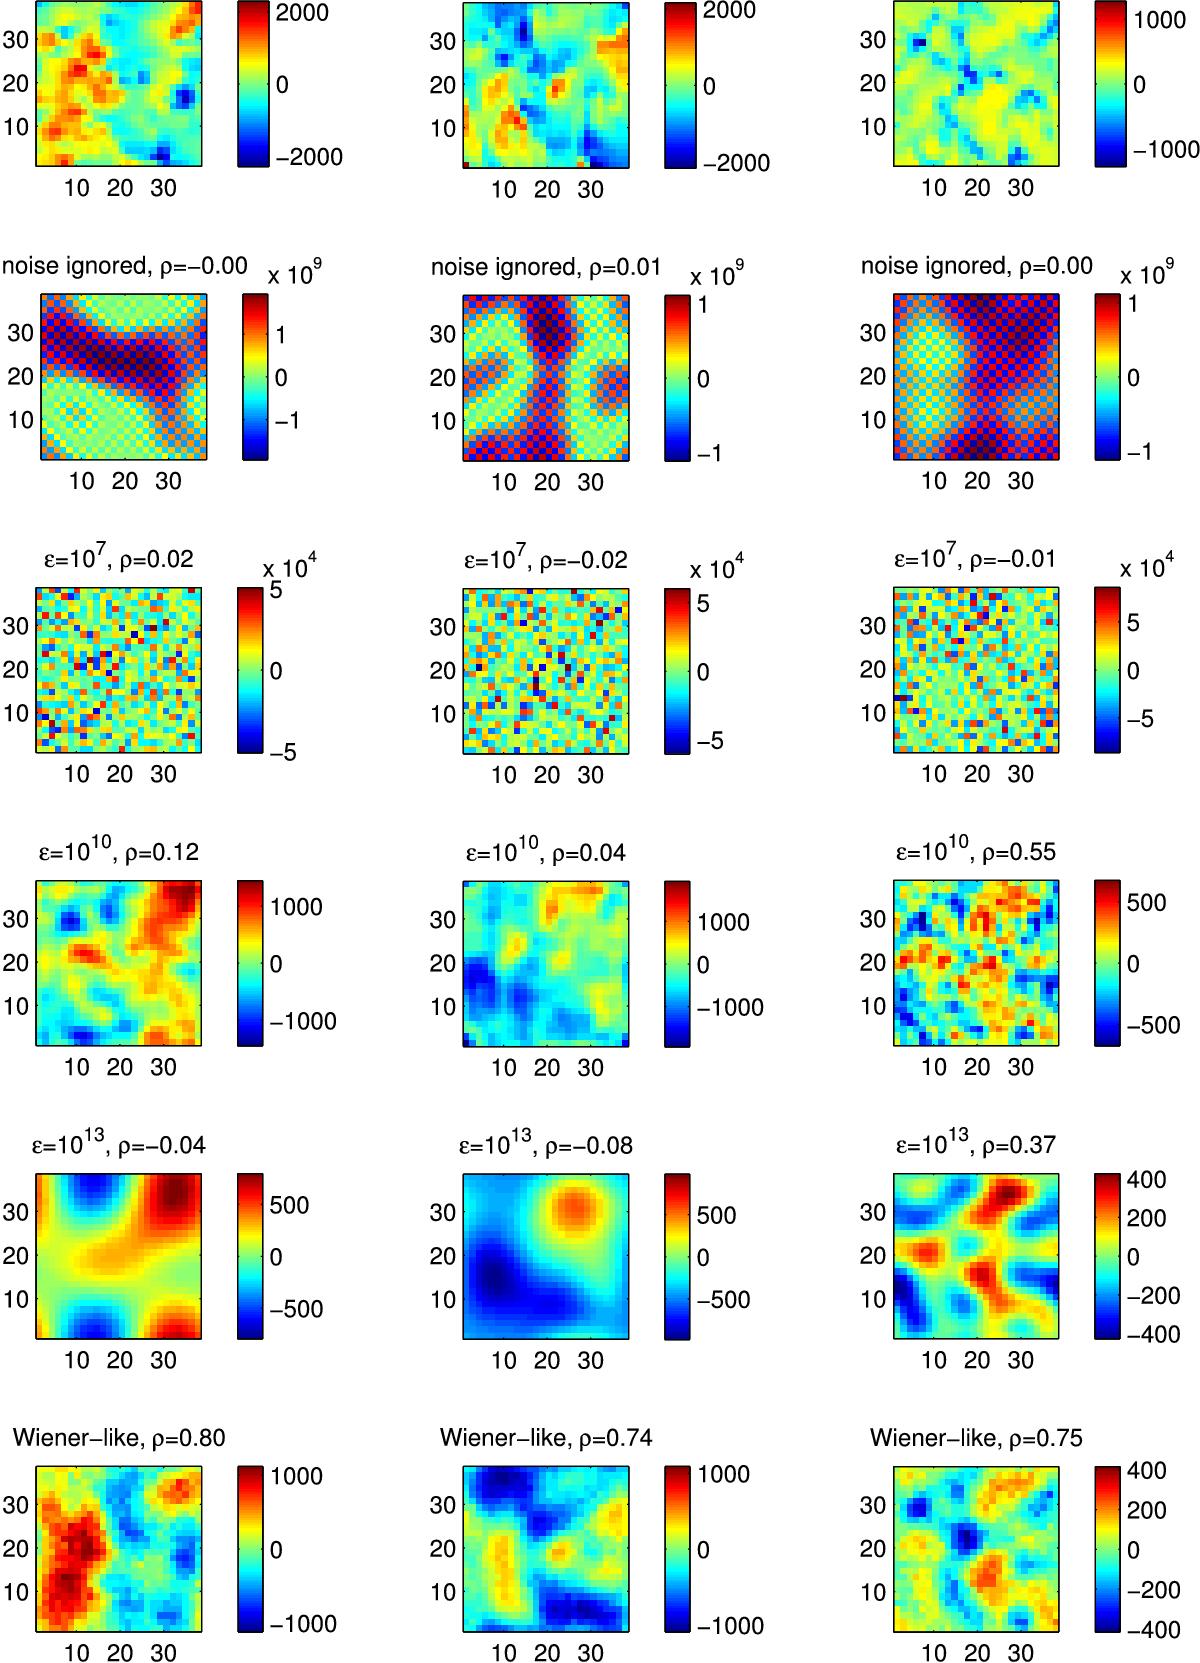
Testing approaches to deal with random noise. An input datacube with a S/N of 100 (i.e. 1% random noise contribution – first row) was reconstructed with the basic method ignoring the noise (second row), ad-hoc regularisation with a set of values of regularisation parameter (third to fifth row) and the Wiener-like filtering approach (last row). The correlation coefficient for the whole cube between the input velocity field and the reconstruction is given in the titles of the plot panels. Colour-bars have the units of km s-1 (violet indicates fast variations from pixel to pixel) and the field-of-view shown here covers 38 Mm × 38 Mm in the horizontal directions.
Current usage metrics show cumulative count of Article Views (full-text article views including HTML views, PDF and ePub downloads, according to the available data) and Abstracts Views on Vision4Press platform.
Data correspond to usage on the plateform after 2015. The current usage metrics is available 48-96 hours after online publication and is updated daily on week days.
Initial download of the metrics may take a while.