Fig. 6
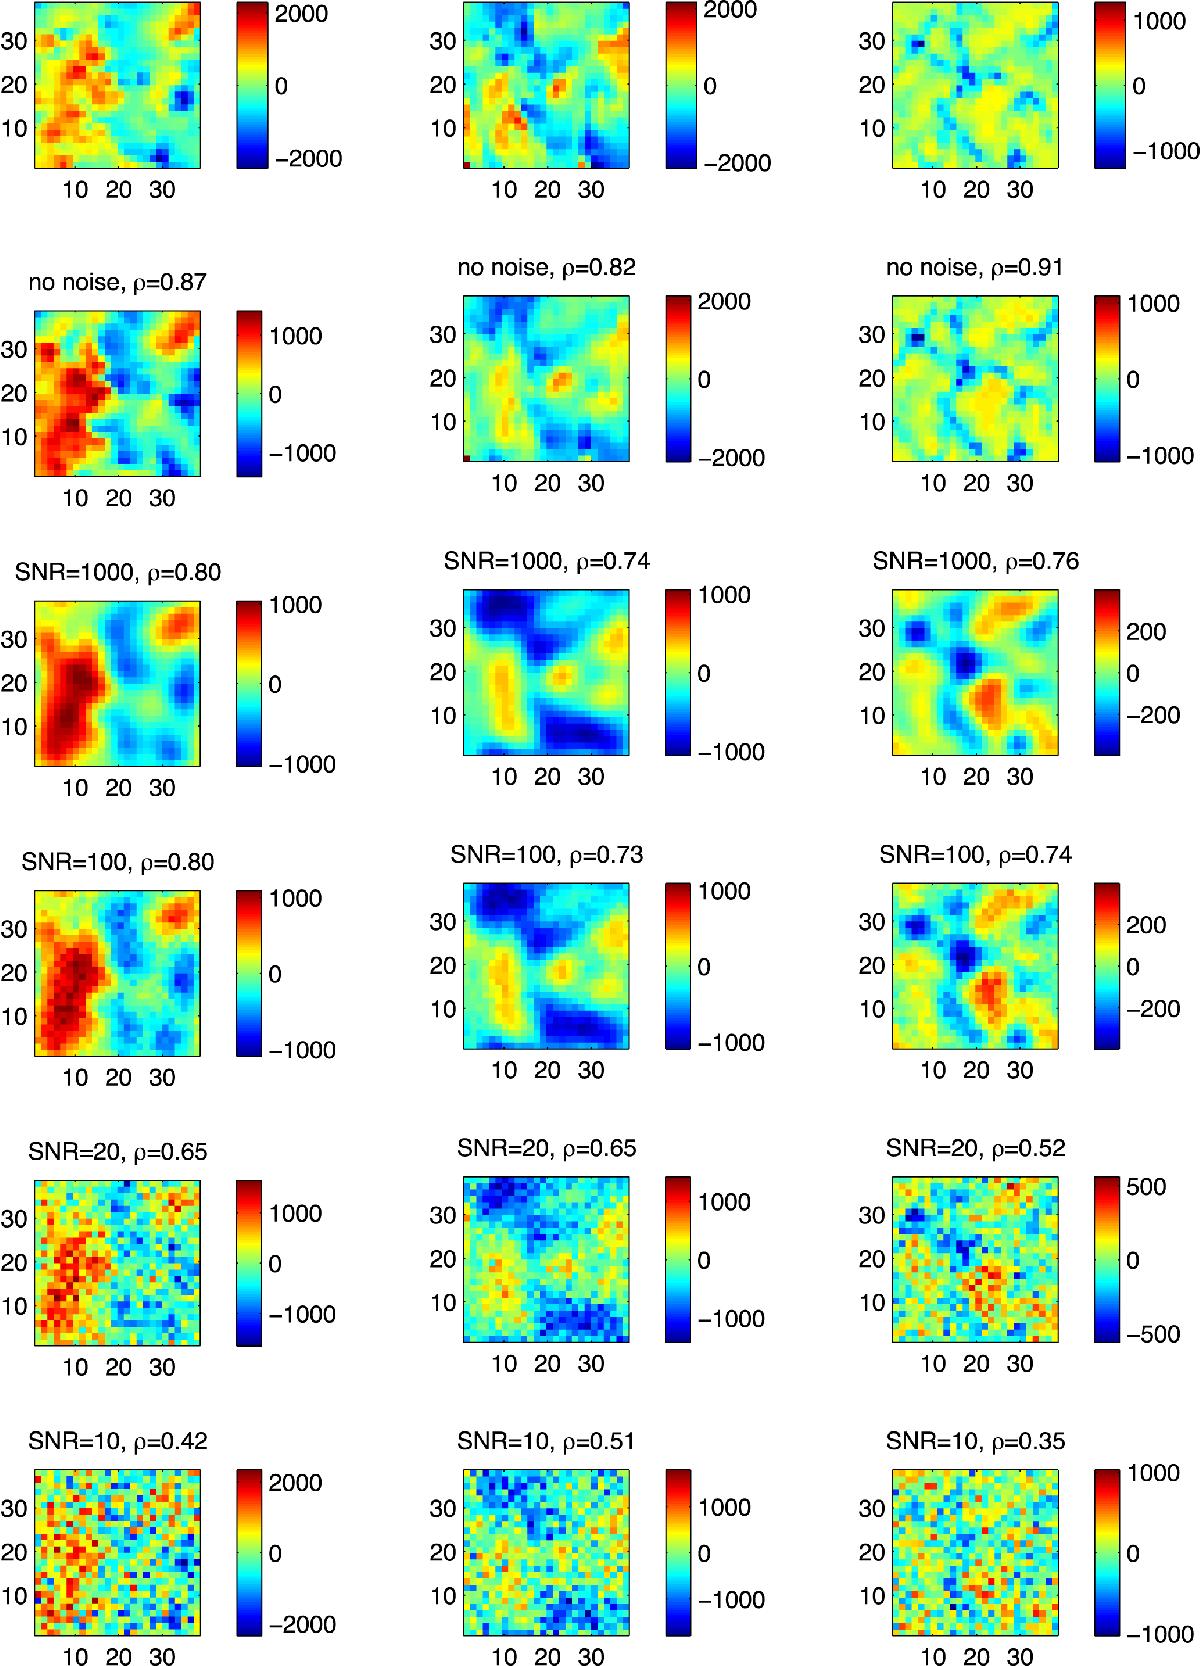
Maps of all components of the flow at the depth of 1 Mm for various levels of the random noise. Maps for the x component, the y component and the vertical z component of velocity are found in the left-hand, the middle and the right-hand column, respectively. The rows contain the input velocity field in the first row and reconstructions with increasing level of random noise in order from top to bottom. Panels with given S/N value were reconstructed using a Wiener-like approach. The correlation coefficient for the whole cube between the input velocity field and the reconstruction is given in the titles of the plot panels. Colour-bars have the units of km s-1 and the field-of-view shown here covers 38 Mm × 38 Mm in the horizontal directions.
Current usage metrics show cumulative count of Article Views (full-text article views including HTML views, PDF and ePub downloads, according to the available data) and Abstracts Views on Vision4Press platform.
Data correspond to usage on the plateform after 2015. The current usage metrics is available 48-96 hours after online publication and is updated daily on week days.
Initial download of the metrics may take a while.