Fig. 4
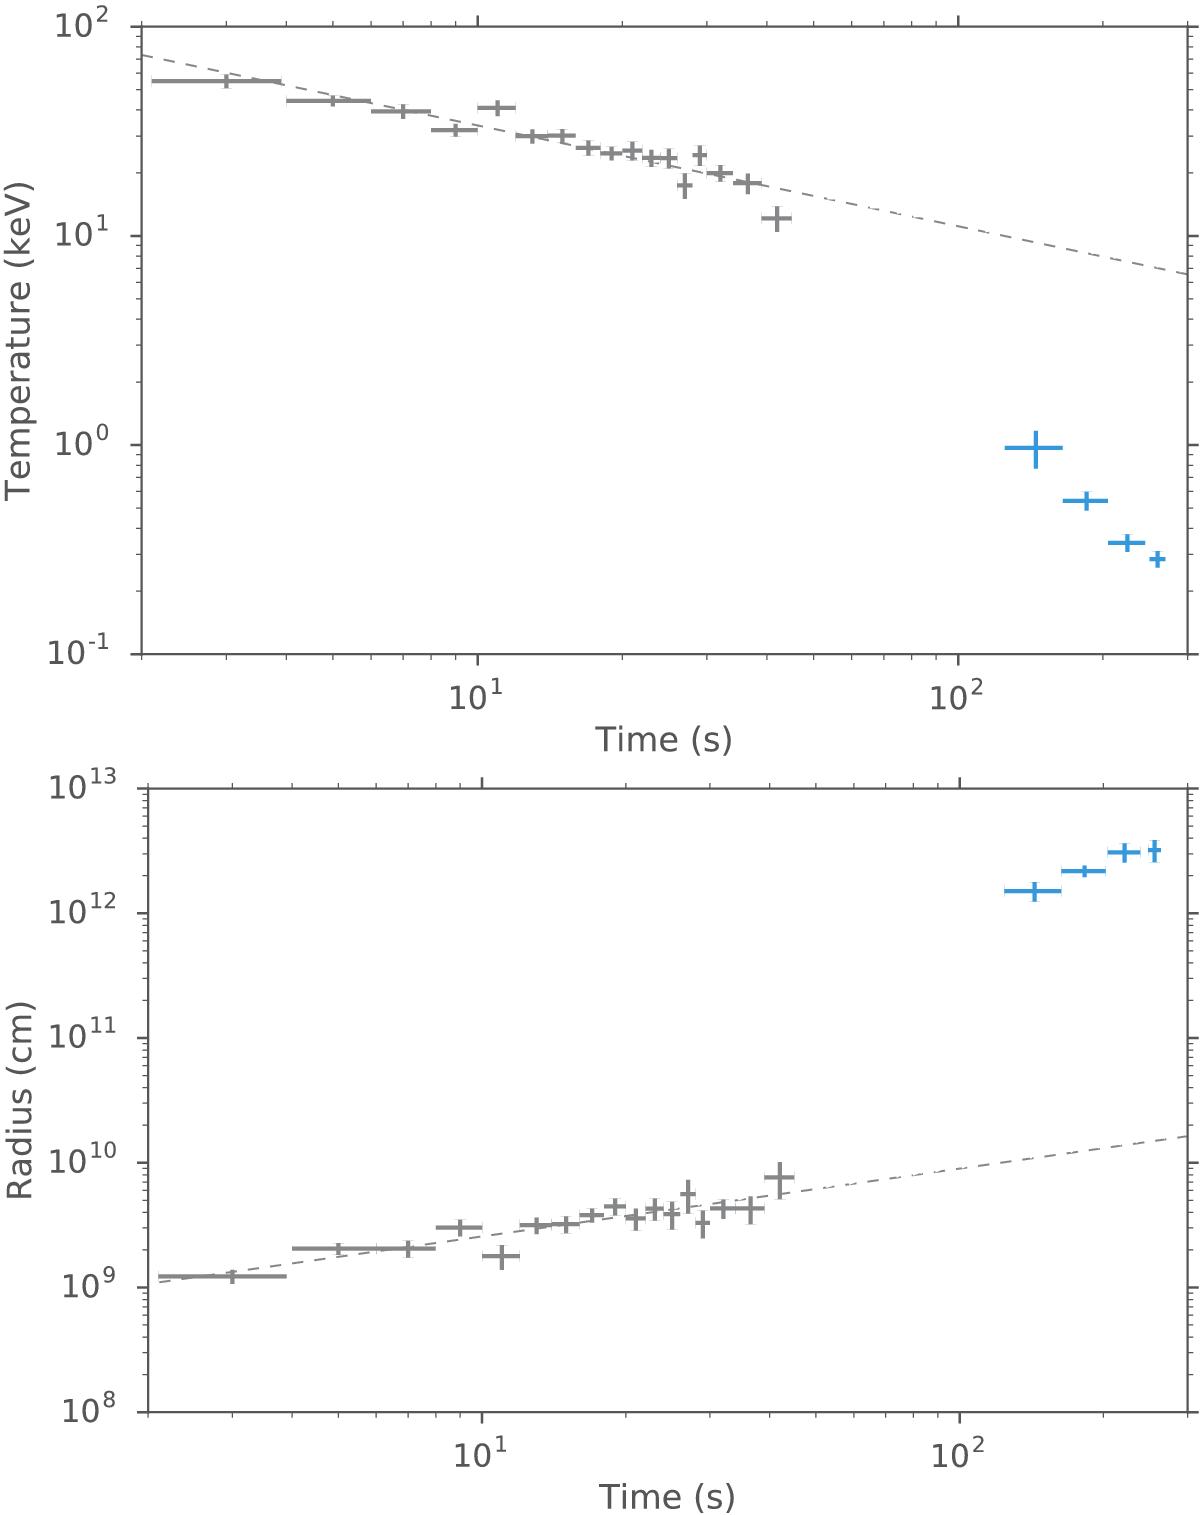
Temperature and radius of the thermal component in the prompt emission (gray points) and in the afterglow (blue points), plotted in the observer’s frame. Upper: single power-law fitting of the temperature in the prompt emission (dashed line, power-law index ~−0.5) clearly shows its extrapolation lays much higher than the temperature in the afterglow (power-law index ~−2). Bottom: radius in the afterglow (~1012 cm) is much larger than the radius in the prompt emission (109–1010 cm). The value of temperature and radius in the prompt emission are reproduced from (Izzo et al. 2012).
Current usage metrics show cumulative count of Article Views (full-text article views including HTML views, PDF and ePub downloads, according to the available data) and Abstracts Views on Vision4Press platform.
Data correspond to usage on the plateform after 2015. The current usage metrics is available 48-96 hours after online publication and is updated daily on week days.
Initial download of the metrics may take a while.