Fig. 5
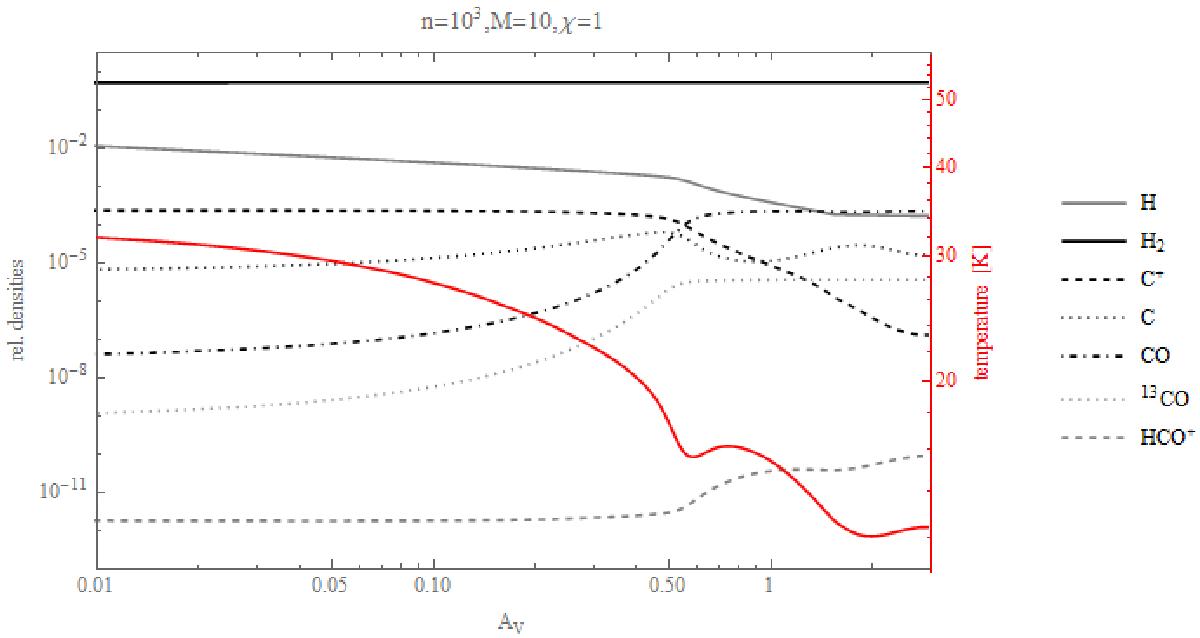
Chemical profile of a clump with a surface volume hydrogen densities of n(H)= 103 cm-3 and a mass of 10 M⊙ penetrated by a standard Drain field of χ = 1. The relative densities of H0, H2, C+, C0, 12/13CO, and HCO+ as function of AV are shown by the black/grey lines (left axis). The temperature profile within the clump is shown by the red line (right axis).
Current usage metrics show cumulative count of Article Views (full-text article views including HTML views, PDF and ePub downloads, according to the available data) and Abstracts Views on Vision4Press platform.
Data correspond to usage on the plateform after 2015. The current usage metrics is available 48-96 hours after online publication and is updated daily on week days.
Initial download of the metrics may take a while.