Fig. 4
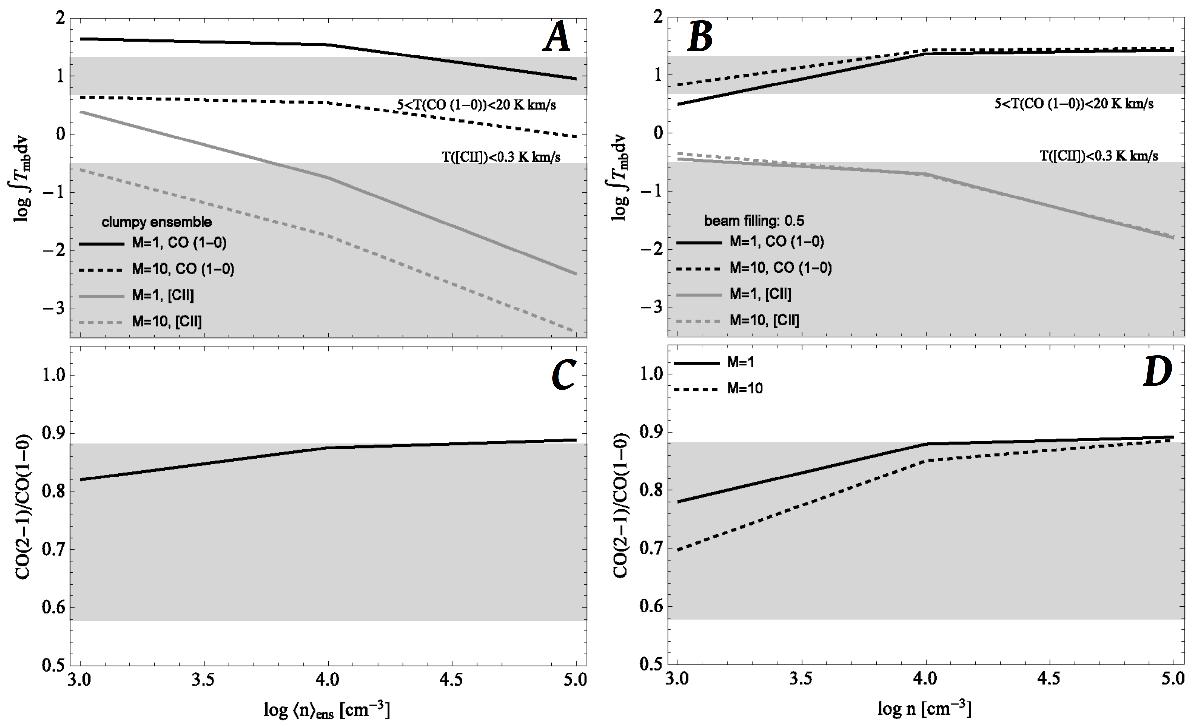
PDR modelling (KOMSA-τ model; Röllig et al. 2006) of clumps with masses of M = 1 and 10 M⊙ for surface volume hydrogen densities of n(H)= 103 to 105 cm-3. The images on the left (A) and C)) illustrate the modelling for an ensemble of clumps. The images on the right (B) and D)) show the modelling for a single clump. For the single clump we anticipated a beam filling factor of Φb = 0.5. The images at the top (A) and B)) show the modelled [Cii] and 12CO(1–0) integrated line intensities. The black and grey lines show the modelled integrated line intensities of CO(1–0) and [C ii]. The style of the line marks the anticipated clump mass. The grey areas show the rough lower and/or upper limits of the CO(1–0) and [C ii] observations. The images at the bottom (C) and D)) illustrate the modelled CO(2–1)/CO(1–0) ratio for clumps with M = 1 and 10 M⊙. The range of the observed CO(2–1)/CO(1–0) ratio (≃0.73 ± 0.16) is marked by the grey area.
Current usage metrics show cumulative count of Article Views (full-text article views including HTML views, PDF and ePub downloads, according to the available data) and Abstracts Views on Vision4Press platform.
Data correspond to usage on the plateform after 2015. The current usage metrics is available 48-96 hours after online publication and is updated daily on week days.
Initial download of the metrics may take a while.