Fig. 3
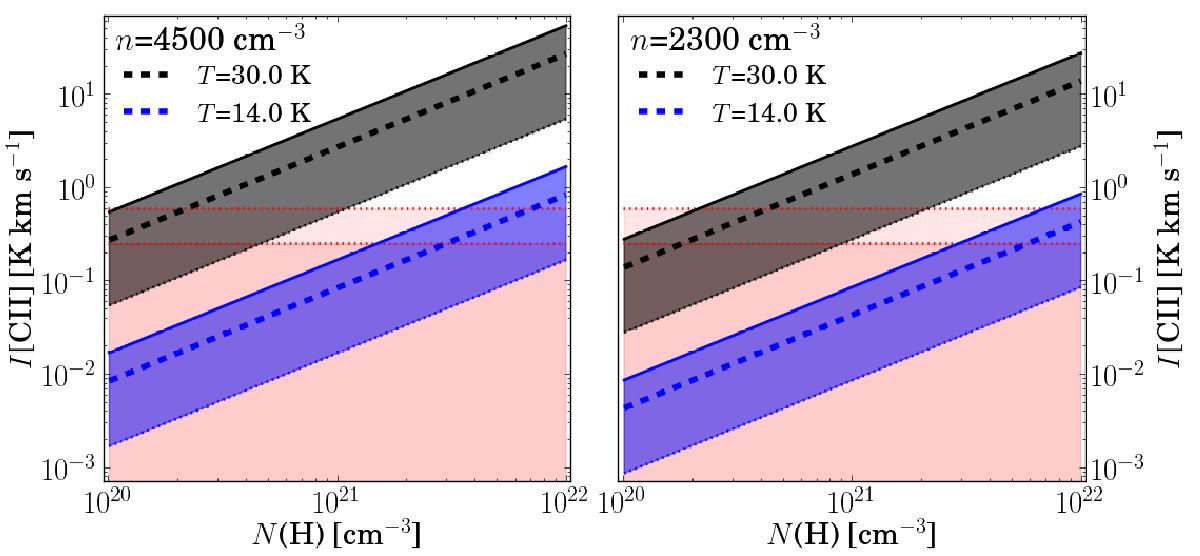
Expected I([C ii]) for n(H)= 4500 cm-3 (left) and n(H)= 2300 cm-3 (right) at different total hydrogen column densities N(H) and temperatures calculated from Eq. (5). The filled grey areas show the expected I([C ii]) for a T = 30 K. The blue areas show the expected I([C ii]) for a cold cloud with a kinetic gas temperature of 14 K, as indicated by the CO(2–1)/CO(1–0) ratio. The dashed lines (---) represent the I([C ii]) for a beam filling factor of Φb = 0.5. The upper and lower edge of the grey and blue filled areas shows the I([C ii]) for a beam filling factor of Φb = 1 and Φb = 0.1, respectively. The red areas mark the upper limits of the [C ii] observations.
Current usage metrics show cumulative count of Article Views (full-text article views including HTML views, PDF and ePub downloads, according to the available data) and Abstracts Views on Vision4Press platform.
Data correspond to usage on the plateform after 2015. The current usage metrics is available 48-96 hours after online publication and is updated daily on week days.
Initial download of the metrics may take a while.