Fig. 1
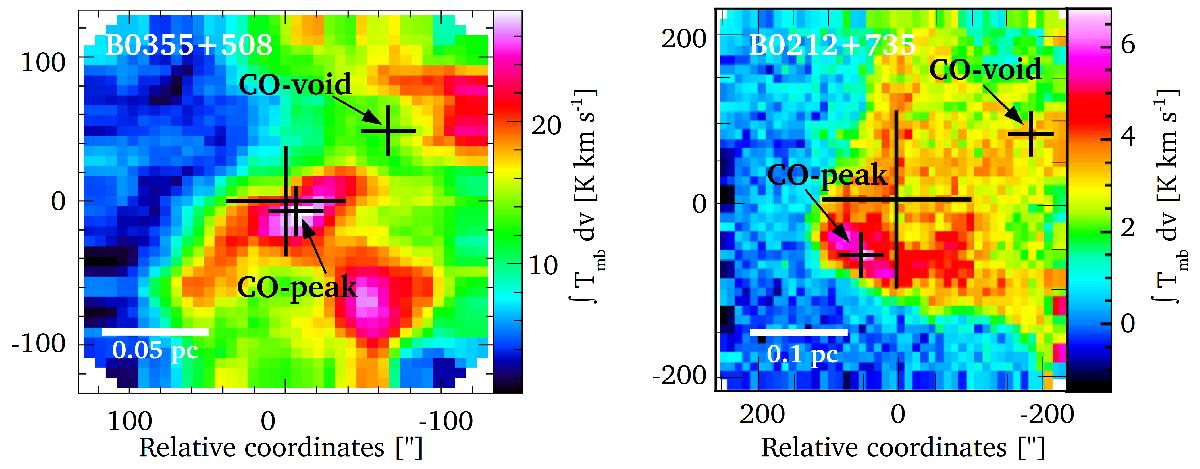
Integrated CO (J = 1–0) emission around B0355+508 (Liszt & Pety 2012) and B0212+735 (Pety & Liszt, in prep.). Small crosses mark the positions observed in [C ii]. The large cross in the middle marks the lines of sight towards B0355+508 and B0212+735. The length of the white bar corresponds to 0.05 pc in B0355+508 and 0.1 pc in B0212+735 for an assumed source distances of 150 pc (Liszt & Pety 2012).
Current usage metrics show cumulative count of Article Views (full-text article views including HTML views, PDF and ePub downloads, according to the available data) and Abstracts Views on Vision4Press platform.
Data correspond to usage on the plateform after 2015. The current usage metrics is available 48-96 hours after online publication and is updated daily on week days.
Initial download of the metrics may take a while.