Free Access
Fig. 8
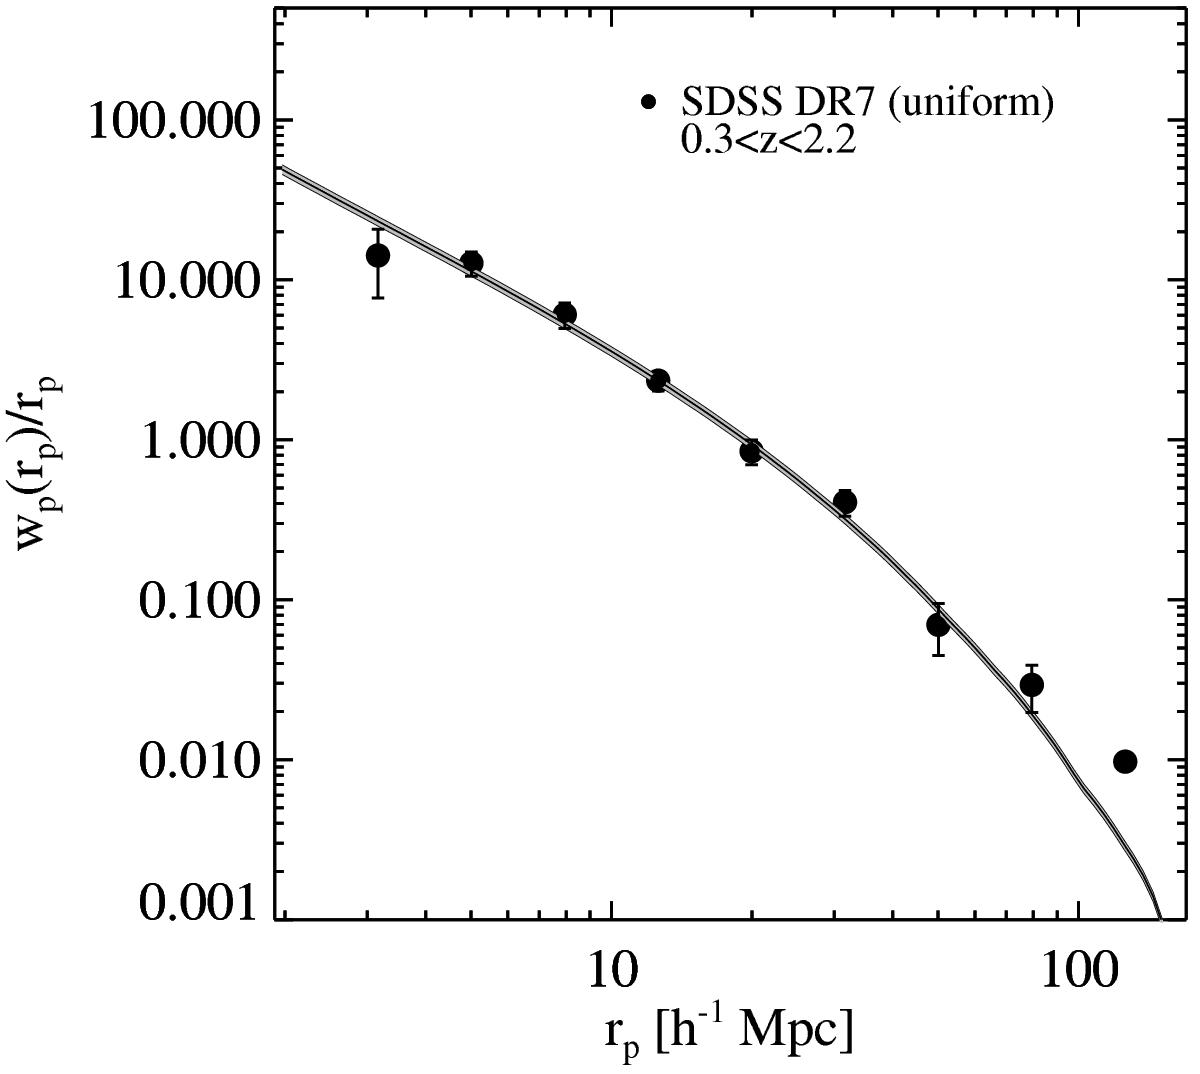
Real-space correlation function for the SDSS DR7 quasar uniform sample with 0.3 ≤ z ≤ 2.3. The solid line denotes the model ![]() defined in Eq. (8)and the shaded areas are the 1σ uncertainties. Errors bars are the square root of the diagonal elements from the covariance matrix computed using the jackknife method.
defined in Eq. (8)and the shaded areas are the 1σ uncertainties. Errors bars are the square root of the diagonal elements from the covariance matrix computed using the jackknife method.
Current usage metrics show cumulative count of Article Views (full-text article views including HTML views, PDF and ePub downloads, according to the available data) and Abstracts Views on Vision4Press platform.
Data correspond to usage on the plateform after 2015. The current usage metrics is available 48-96 hours after online publication and is updated daily on week days.
Initial download of the metrics may take a while.