Fig. 13
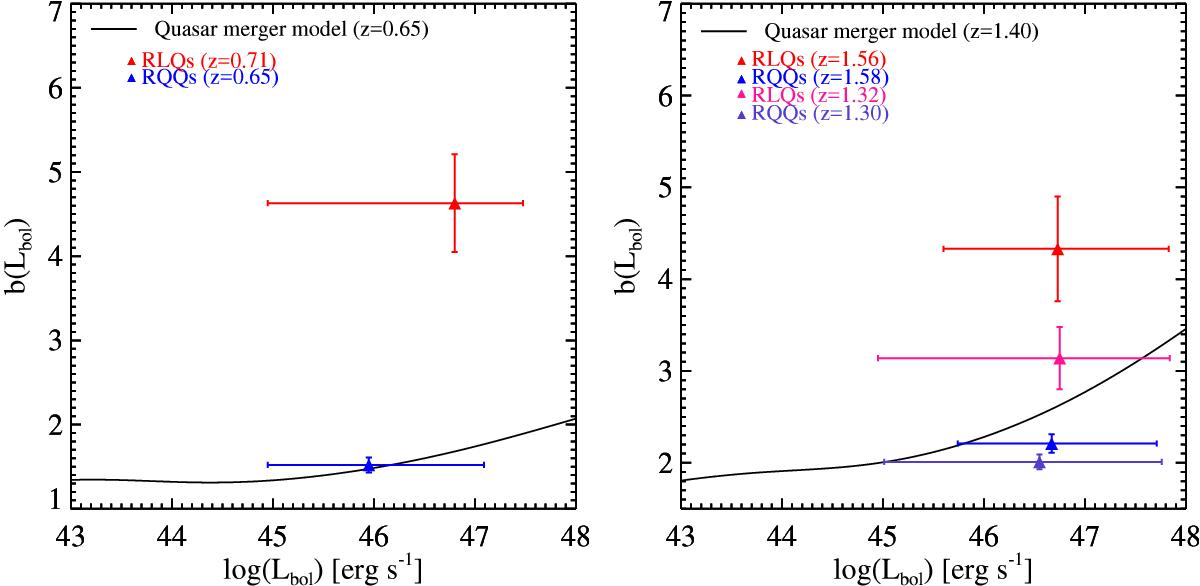
Bias parameter b as a function of bolometric luminosity for our RLQs and RQQs in the ranges 0.3 ≤ z ≤ 1.0 (left) and 1.0 ≤ z ≤ 2.0 (right). Errors in the Lbol axis are the dispersion values for each different quasar sample. The solid lines in both panels denote the predicted bias luminosity evolution according to the Shen (2009) model, which predicts that quasar activity is triggered by galaxy mergers.
Current usage metrics show cumulative count of Article Views (full-text article views including HTML views, PDF and ePub downloads, according to the available data) and Abstracts Views on Vision4Press platform.
Data correspond to usage on the plateform after 2015. The current usage metrics is available 48-96 hours after online publication and is updated daily on week days.
Initial download of the metrics may take a while.