Fig. 10
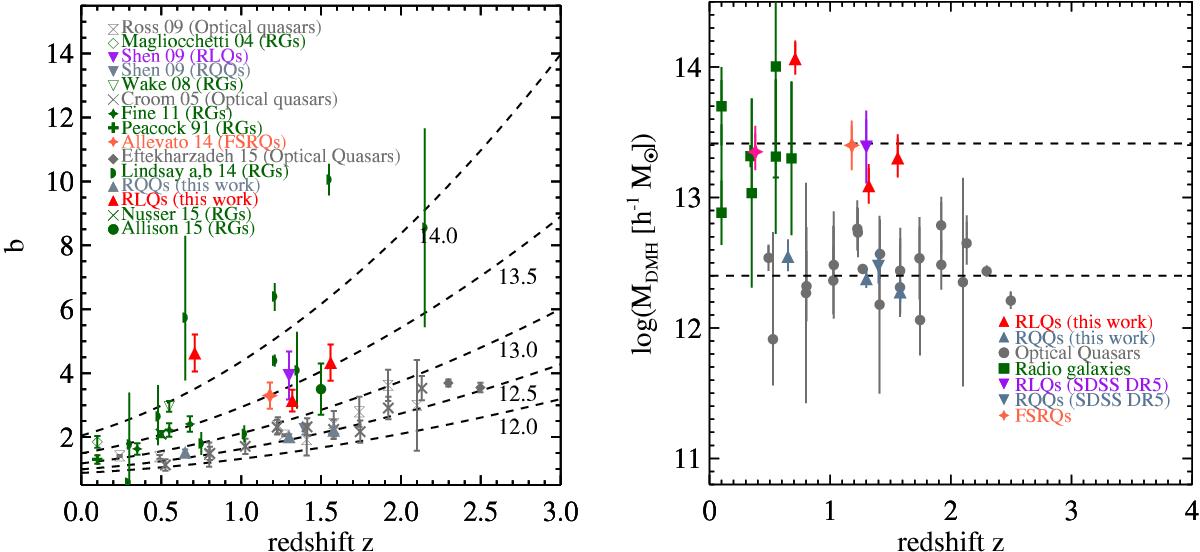
Left: derived linear bias parameter b as a function of redshift for radio and optical AGN samples represented by the corresponding legend. Red or gray triangles represent the RLQs or RQQs sub-samples of this work, respectively. The dashed lines denote the expected redshift evolution of DMH masses based on the models from Sheth et al. (2001) with ![]() . Right: typical DMH masses MDMH against redshift for RLQs and RQQs from our sample (red and gray triangles, respectively), RLQs and RQQs from SDSS DR5 (purple and gray downward triangles, Shen et al. 2009, respectively), optical quasars (gray circle, Croom et al. 2005; Ross et al. 2009; Eftekharzadeh et al. 2015), radio galaxies (RGs, dark green squares, Peacock & Nicholson 1991; Magliocchetti et al. 2004; Wake et al. 2008; Fine et al. 2011; Lindsay et al. 2014b,a; Allison et al. 2015; Nusser & Tiwari 2015), and flat-spectrum radio quasars (FSRQs) (orange star, Allevato et al. 2014a). For comparison, we show with dashed lines the mass values corresponding to
. Right: typical DMH masses MDMH against redshift for RLQs and RQQs from our sample (red and gray triangles, respectively), RLQs and RQQs from SDSS DR5 (purple and gray downward triangles, Shen et al. 2009, respectively), optical quasars (gray circle, Croom et al. 2005; Ross et al. 2009; Eftekharzadeh et al. 2015), radio galaxies (RGs, dark green squares, Peacock & Nicholson 1991; Magliocchetti et al. 2004; Wake et al. 2008; Fine et al. 2011; Lindsay et al. 2014b,a; Allison et al. 2015; Nusser & Tiwari 2015), and flat-spectrum radio quasars (FSRQs) (orange star, Allevato et al. 2014a). For comparison, we show with dashed lines the mass values corresponding to ![]() When bias and mass estimations are not provided by the authors we use the reported power-law best-fitting values to estimate b and MDMH (Peebles 1980; Krumpe et al. 2010).
When bias and mass estimations are not provided by the authors we use the reported power-law best-fitting values to estimate b and MDMH (Peebles 1980; Krumpe et al. 2010).
Current usage metrics show cumulative count of Article Views (full-text article views including HTML views, PDF and ePub downloads, according to the available data) and Abstracts Views on Vision4Press platform.
Data correspond to usage on the plateform after 2015. The current usage metrics is available 48-96 hours after online publication and is updated daily on week days.
Initial download of the metrics may take a while.