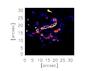
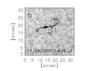
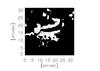
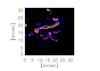
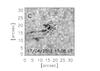
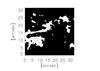
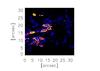
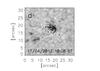
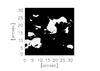
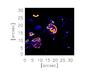
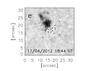
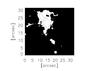
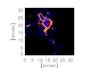
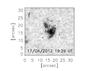
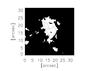
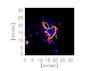
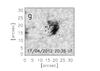
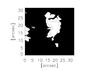
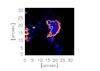
Fig. A.1
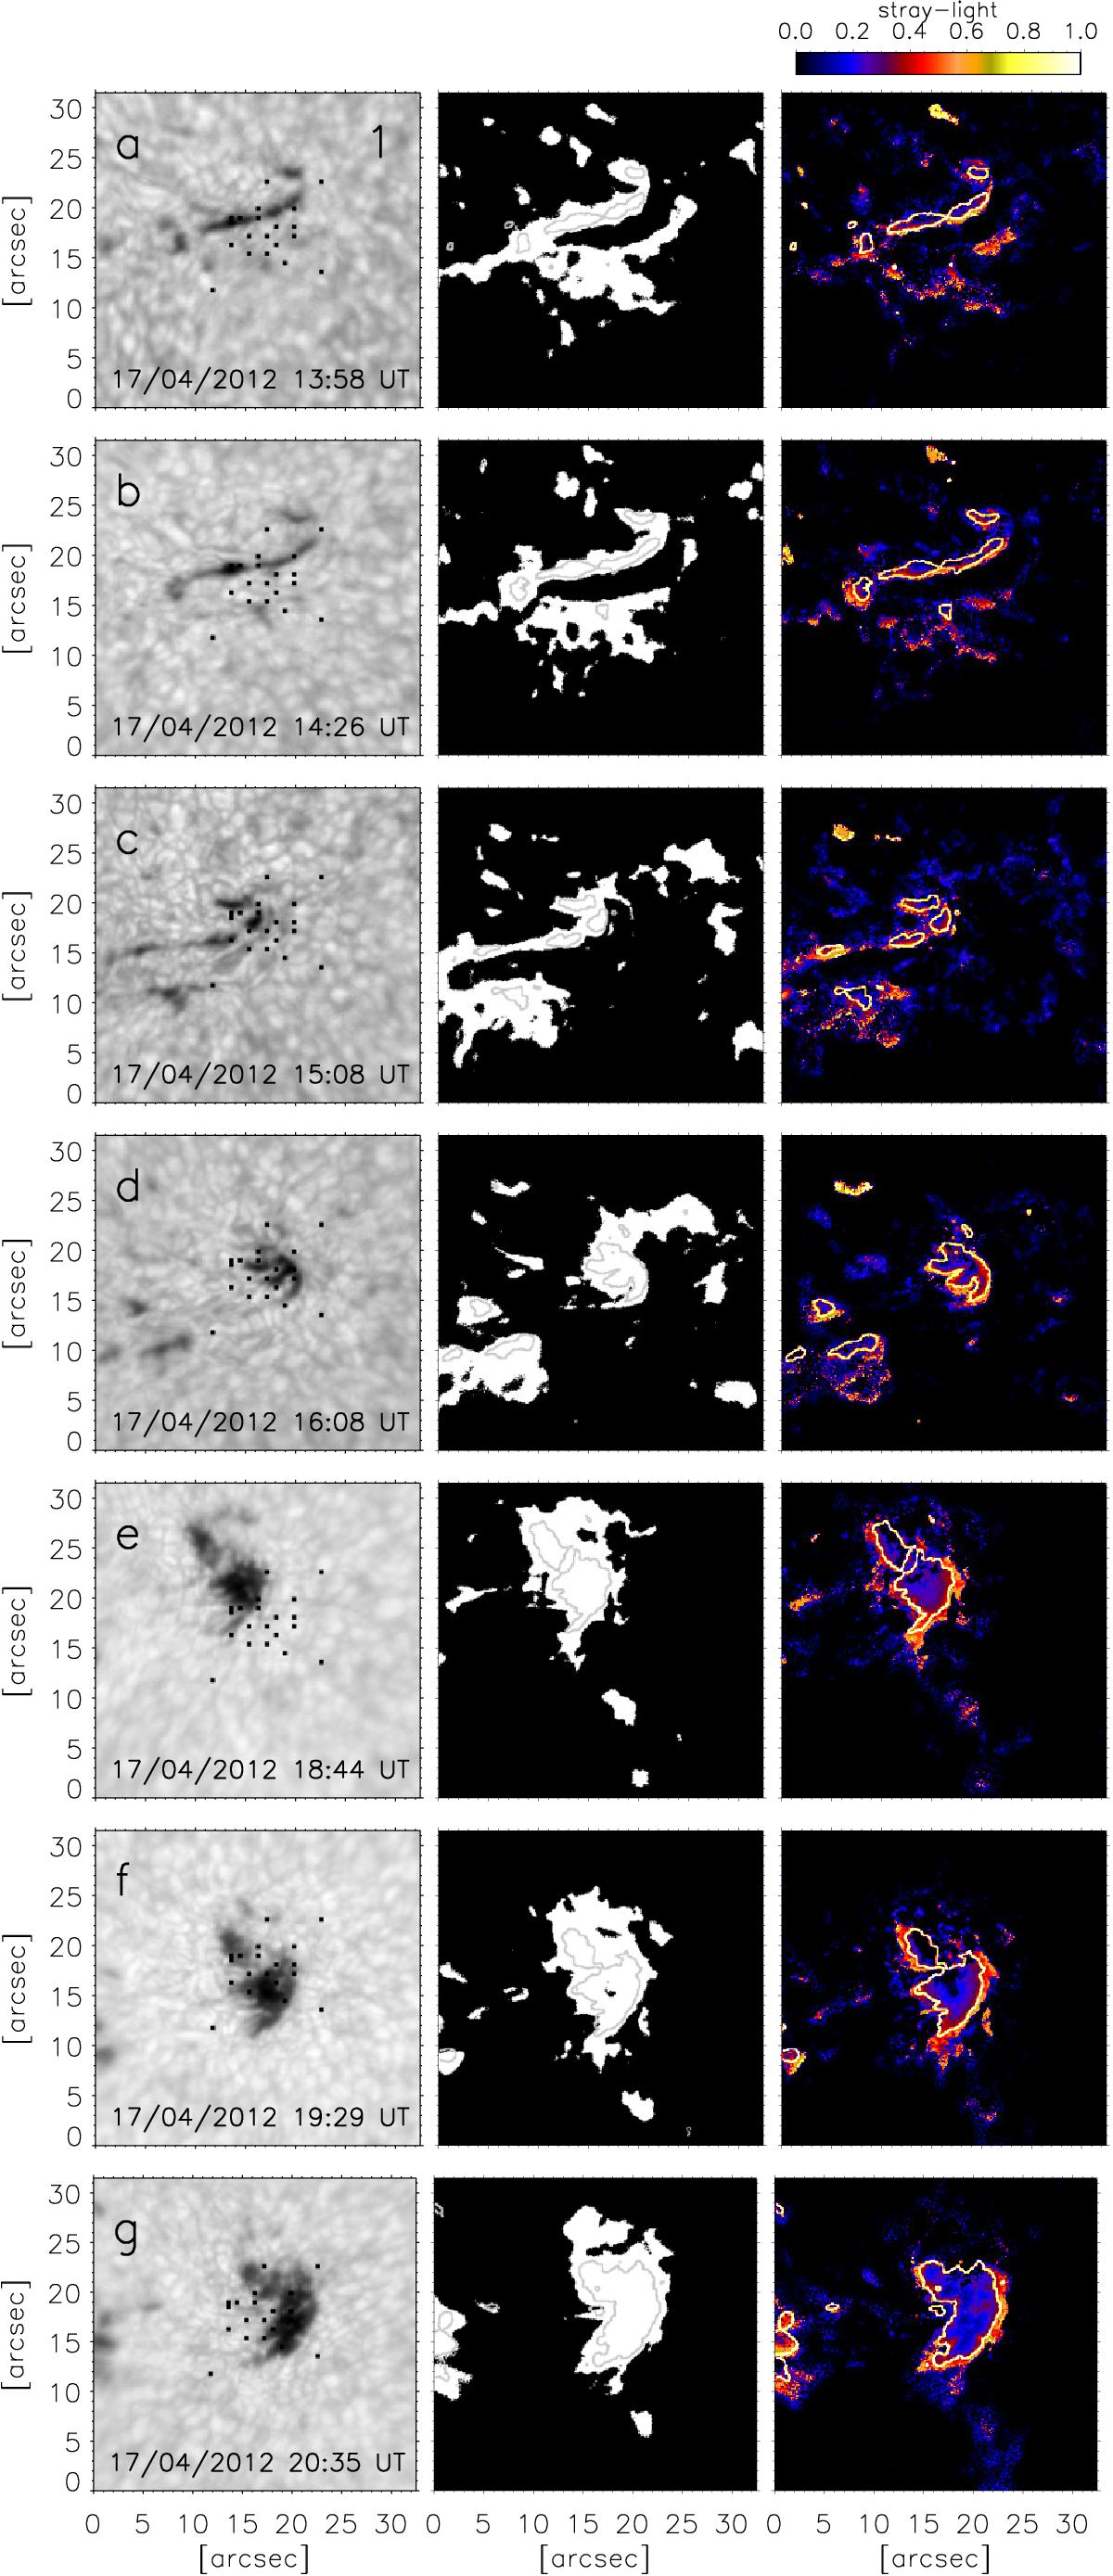
Example of continuum intensity images (left column), mask of the magnetic regions identified in the data (middle column, white (black) shows the magnetic (quiet) component) and stray-light fraction (right column) derived from the SIR inversion of the IBIS Fe I 617.3 nm line data, at seven stages of the pore formation at a) 13:58 UT, b) 14:26 UT, c) 15:08 UT, d) 16:08 UT, e) 18:44 UT, f) 19:29 UT, and g) 20:35 UT. North is at the top; west is to the right. The small black squares in the continuum intensity images show the 20 positions considered for the comparison between observed and inverted profiles in Figs. A.2–A.8. The contour line in the panels of the middle and right columns shows the location of the evolving structure singled out in the continuum data, as specified in Fig. 3.
Current usage metrics show cumulative count of Article Views (full-text article views including HTML views, PDF and ePub downloads, according to the available data) and Abstracts Views on Vision4Press platform.
Data correspond to usage on the plateform after 2015. The current usage metrics is available 48-96 hours after online publication and is updated daily on week days.
Initial download of the metrics may take a while.