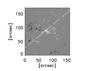
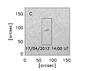
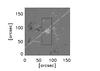
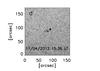
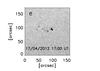
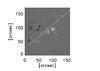
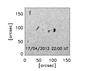
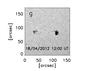
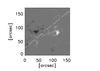
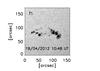
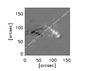
Fig. 1
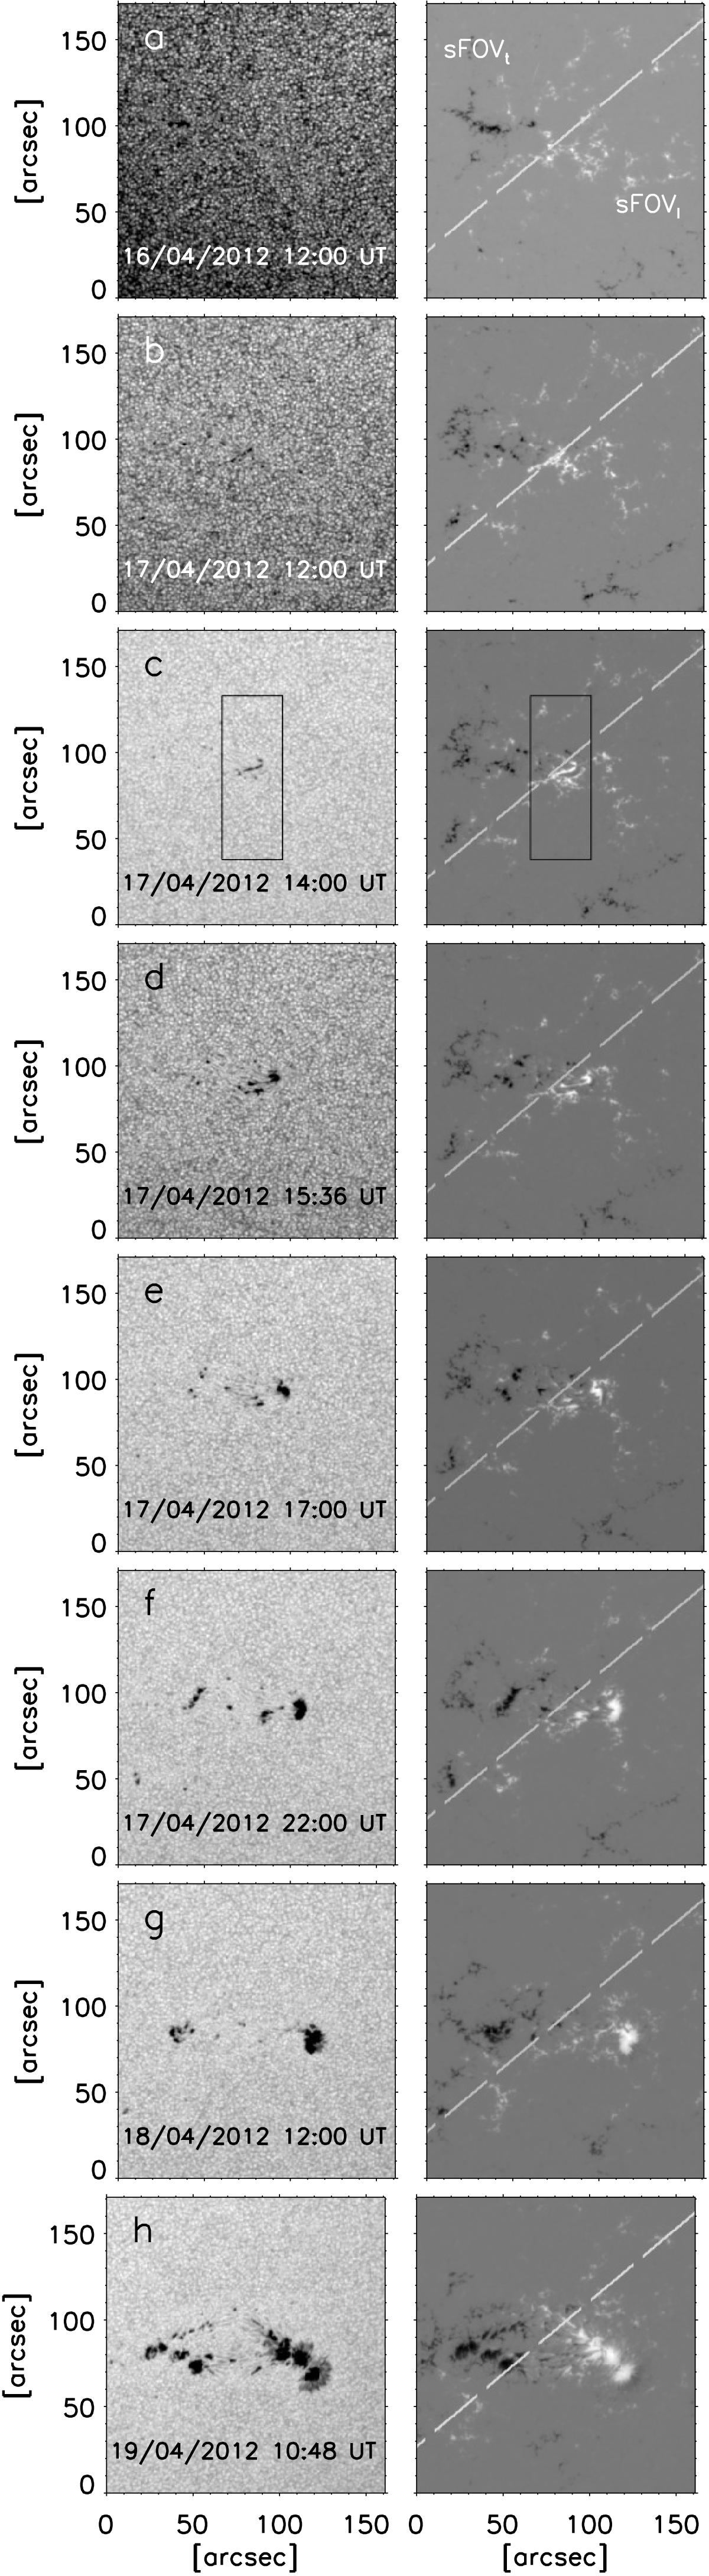
AR 11462 as seen in the SDO/HMI continuum filtergrams (left) and LOS magnetograms (right) from April 16, 2012, 12:00 UT, to April 19, 2012, 10:48 UT. The box in the April 17, 2012, 14:00 UT data show the FOV of IBIS data. More details in Sect. 3.1. The magnetic field in the background magnetogram is shown in the range of values [− 1.5, 1.5] kG. The full temporal evolution of the analysed data is shown in a movie available online.


Current usage metrics show cumulative count of Article Views (full-text article views including HTML views, PDF and ePub downloads, according to the available data) and Abstracts Views on Vision4Press platform.
Data correspond to usage on the plateform after 2015. The current usage metrics is available 48-96 hours after online publication and is updated daily on week days.
Initial download of the metrics may take a while.