Fig. 1
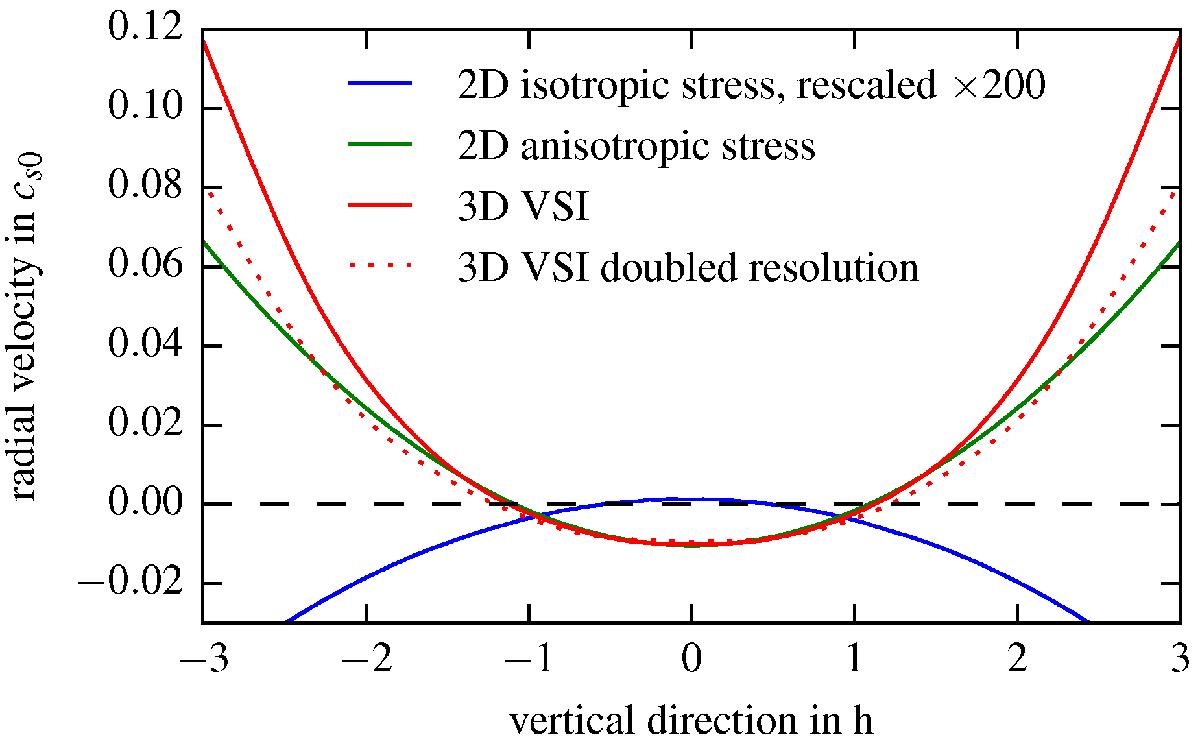
Radial velocity averaged over 50 orbits. We compare the disk with alpha-viscosity (α = 5 × 10⁻⁴, blue curve) to a disk with active VSI (red curve), a disk with active VSI and doubled resolution (red dotted curve) and a viscous disk with anisotropic stress similar to the VSI disk (green curve, details see Sect. 4). For the turbulent disk the velocity has been azimuthally averaged. The profile shown is in units of sound speed cs0 and at r = r0. The viscous case has been rescaled to better visualize the difference.
Current usage metrics show cumulative count of Article Views (full-text article views including HTML views, PDF and ePub downloads, according to the available data) and Abstracts Views on Vision4Press platform.
Data correspond to usage on the plateform after 2015. The current usage metrics is available 48-96 hours after online publication and is updated daily on week days.
Initial download of the metrics may take a while.