Fig. 3
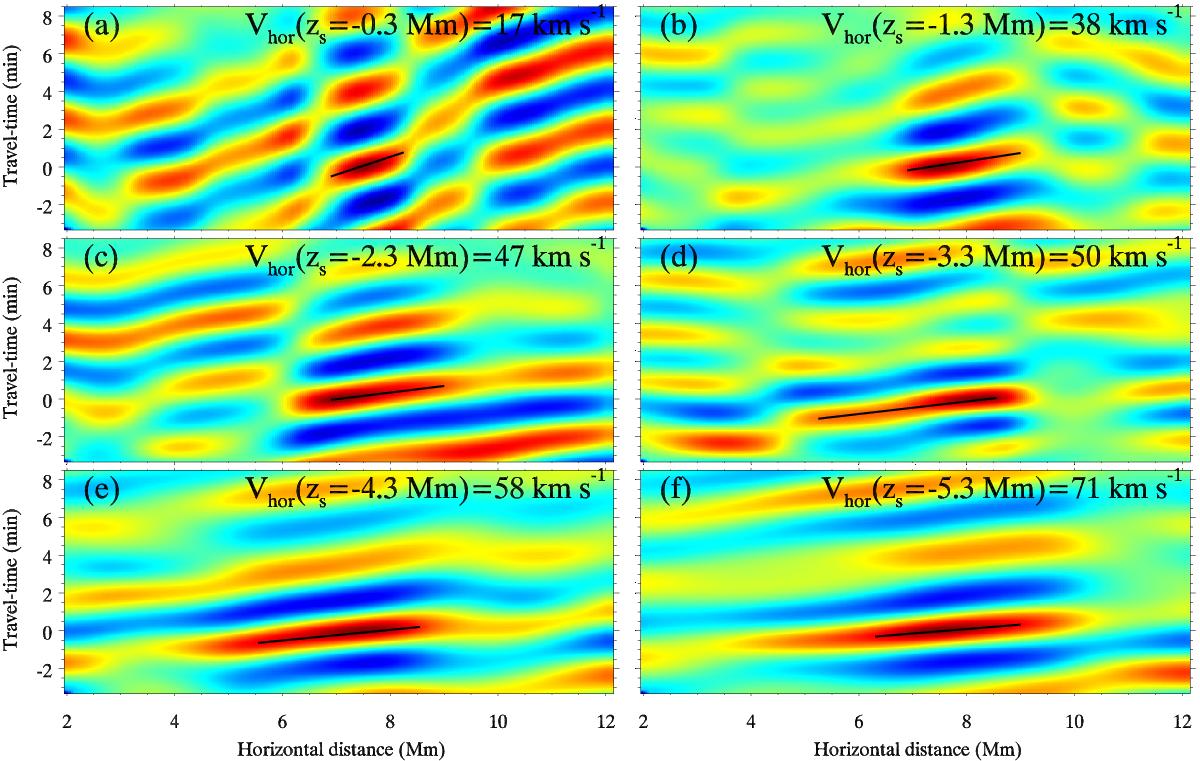
Time-distance diagrams at log τ = −2 for the simulations containing stochastic drivers obtained from the cross-correlation between the vertical velocity at x = 7.5 Mmand the vertical velocity at the x positions indicated in the horizontal axis. Each panel corresponds to a different source depth: zs = −0.3 Mm (a), zs = −1.3 Mm (b), zs = −2.3 Mm (c), zs = −3.3 Mm (d), zs = −4.3 Mm (e), and zs = −5.3 Mm (f).
Current usage metrics show cumulative count of Article Views (full-text article views including HTML views, PDF and ePub downloads, according to the available data) and Abstracts Views on Vision4Press platform.
Data correspond to usage on the plateform after 2015. The current usage metrics is available 48-96 hours after online publication and is updated daily on week days.
Initial download of the metrics may take a while.